PDCA model: An example of PDCA in action
Now that you’ve got a good grasp of the PDCA cycle, let’s bring it to life with a real-world example from manufacturing.
In this lesson, we’ll walk through a full PDCA cycle from a beverage production line. You’ll see how each step plays out and how the team moved from firefighting to fixing the root cause.
The problem description
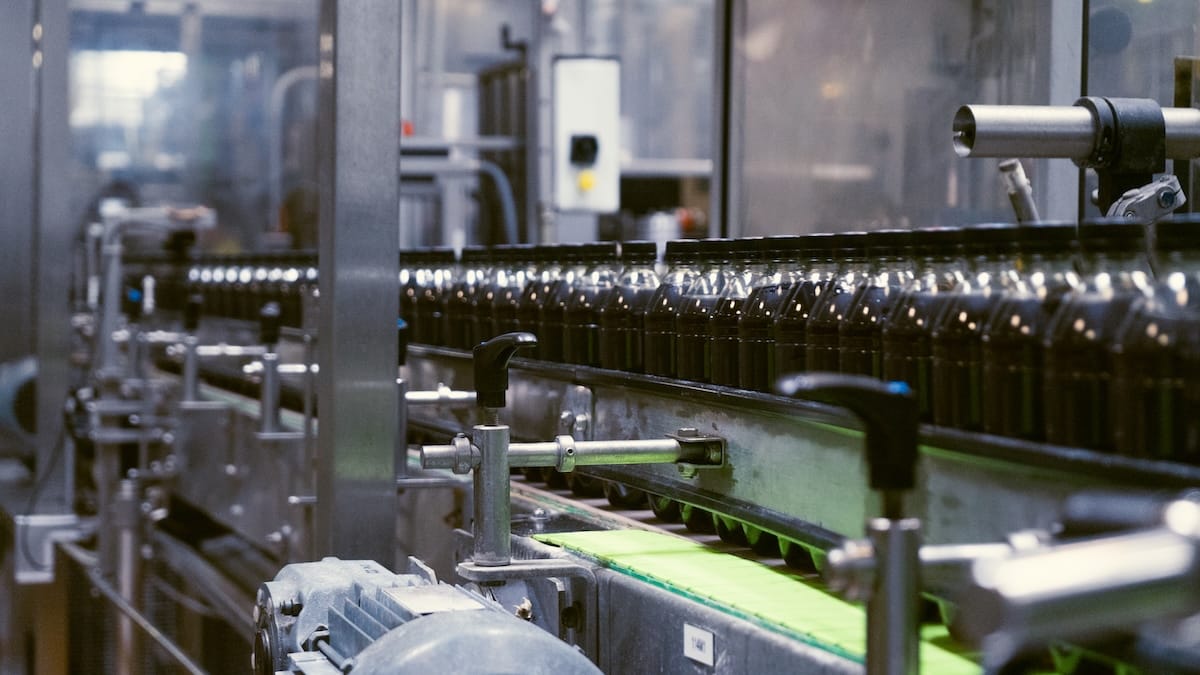
Operators on Line 2 have noticed that bottles are being filled inconsistently. Some are underfilled, others are overfilled.
The problem is leading to rework, waste, and complaints from customers.
Before starting the full PDCA cycle, the team might choose to take a short-term containment action to reduce the immediate impact of the problem.
In our example with inconsistent fill levels, a reasonable containment step could be to inspect the bottles manually at the end of the line and remove any that don’t meet the required fill level, just to avoid shipping bad product while the root cause is still being investigated.
The Plan phase
The team pulls data from the line and sees that about 3% of bottles are being rejected because of fill level issues.
They do a quick Gemba walk to see what’s happening firsthand and they notice something interesting: a key filling valve is wearing out much faster than expected.
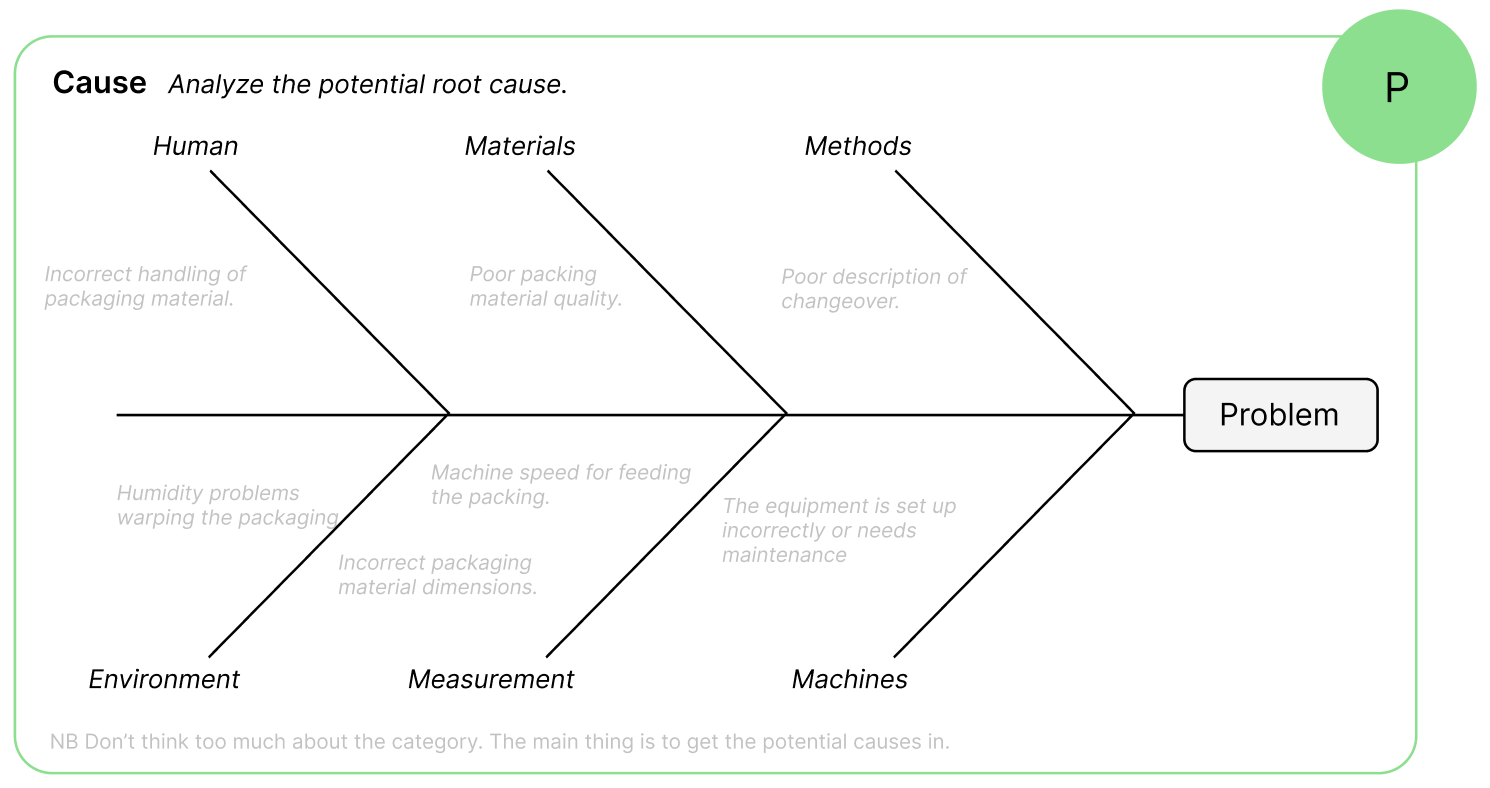
They dig into the root cause using a fishbone diagram and find that the valve isn’t being replaced consistently. It depends on who’s on shift and how busy things are.
The team sets a clear goal to reduce fill-related rejects to less than 1% within two weeks.
To formulate their plans, they use an impact vs. effort matrix to prioritize solutions.
They decide to start a weekly inspection of the valve and replace it earlier than usual, just on Line 2 to begin with.
They clearly document this new activity, and then they move into the next phase.
The Do phase
They roll out the new routine for two weeks of monitoring. Operators are trained to follow a simple inspection checklist at the end of each shift. Maintenance logs are tracked daily.
Everything is documented, and the team is watching how the line performs.
The Check phase
The team maps out their KPIs and begins to monitor how the new solution is performing.
After two weeks, the data shows a clear improvement: Rejects from fill issues have dropped from 3% to 0.8%.
Production is running more smoothly, and operators are reporting fewer stoppages and quality checks.
The team meets to review the outcome. Then, based on the data and the feedback, they decide to move forward.
The Act phase
They update the standard work to include the new inspection routine, and then they roll it out to other lines with the same equipment.
Everyone is trained, and the change becomes part of how they work moving forward.
[CTA]
Conclusion
That’s a complete PDCA cycle:
- Root cause identified
- Change tested
- Results checked
- Process updated and scaled
And because it was documented, the improvement can be referenced and repeated any time the issue arises again.
That’s PDCA in action; simple, structured, and based on facts.
What’s next?
In the next lesson, we’ll show you how to digitally manage the PDCA process using Factbird Action Plans so improvements don’t just live on a whiteboard.
In the meantime, if you’re ready to try PDCA yourself:
👉 Download our free PDCA template.
🎧 Listen to our podcast episode on PDCA.
💡 Or explore how you can track improvement digitally with Factbird Action Plans in our Knowledge Excellence App.