Visual Intelligence
Turn your blind spots into insights
Video footage becomes production data, so you can see which processes cost you the most, and why.


Why Visual Intelligence
Find the minutes your machine data can’t explain
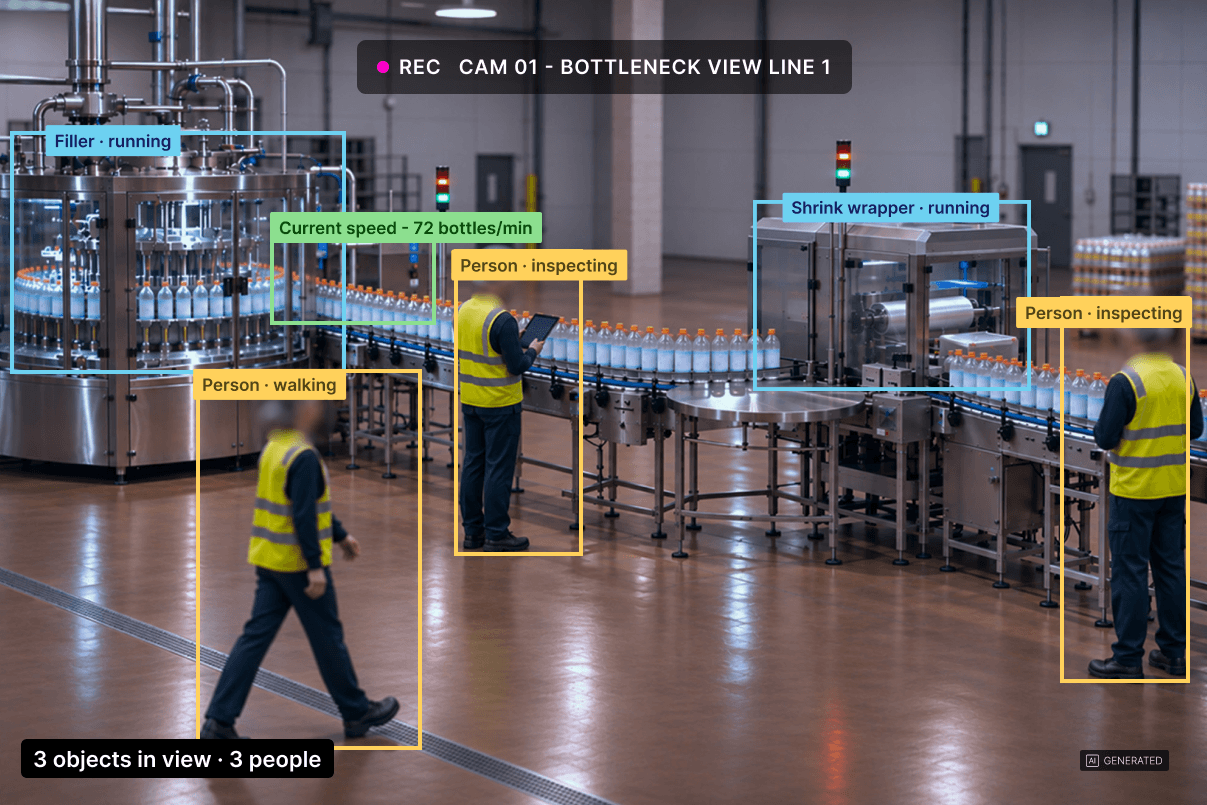
Visual Intelligence uses cameras and AI to capture what happens around your machines. AI processes the footage right at the line and converts it into numbers that show up in Factbird next to your downtime and performance data.
Measure what your sensors miss
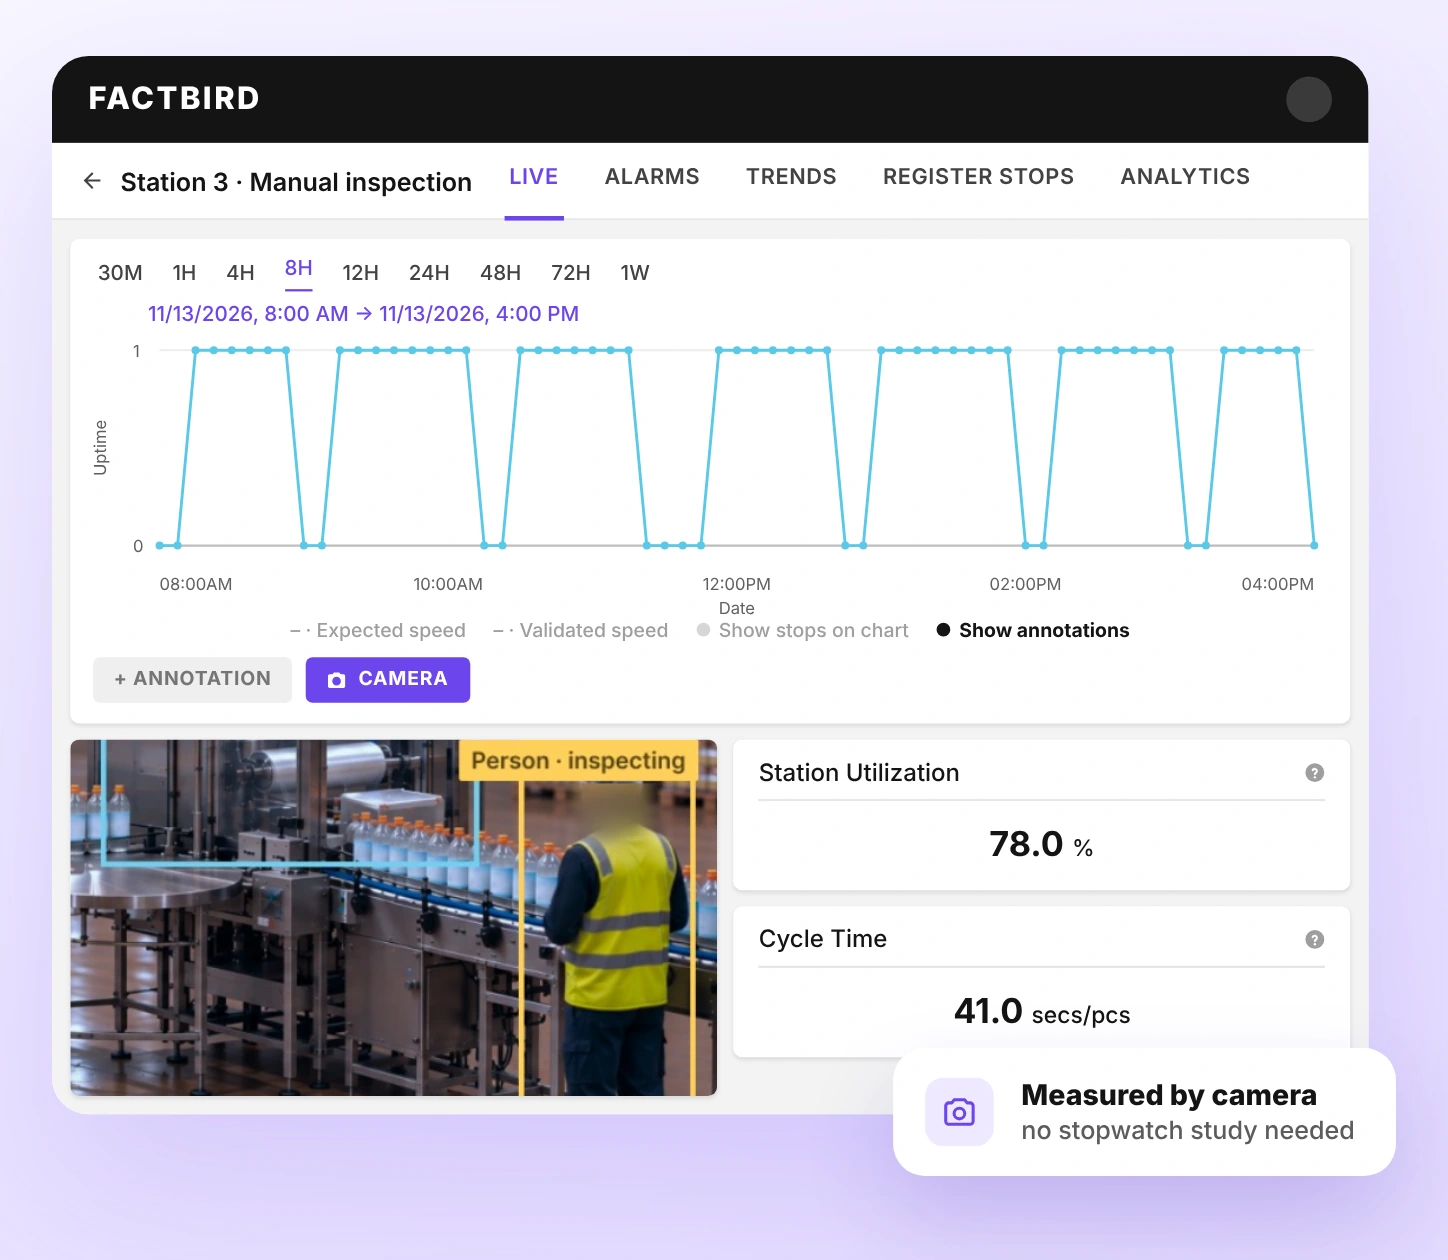
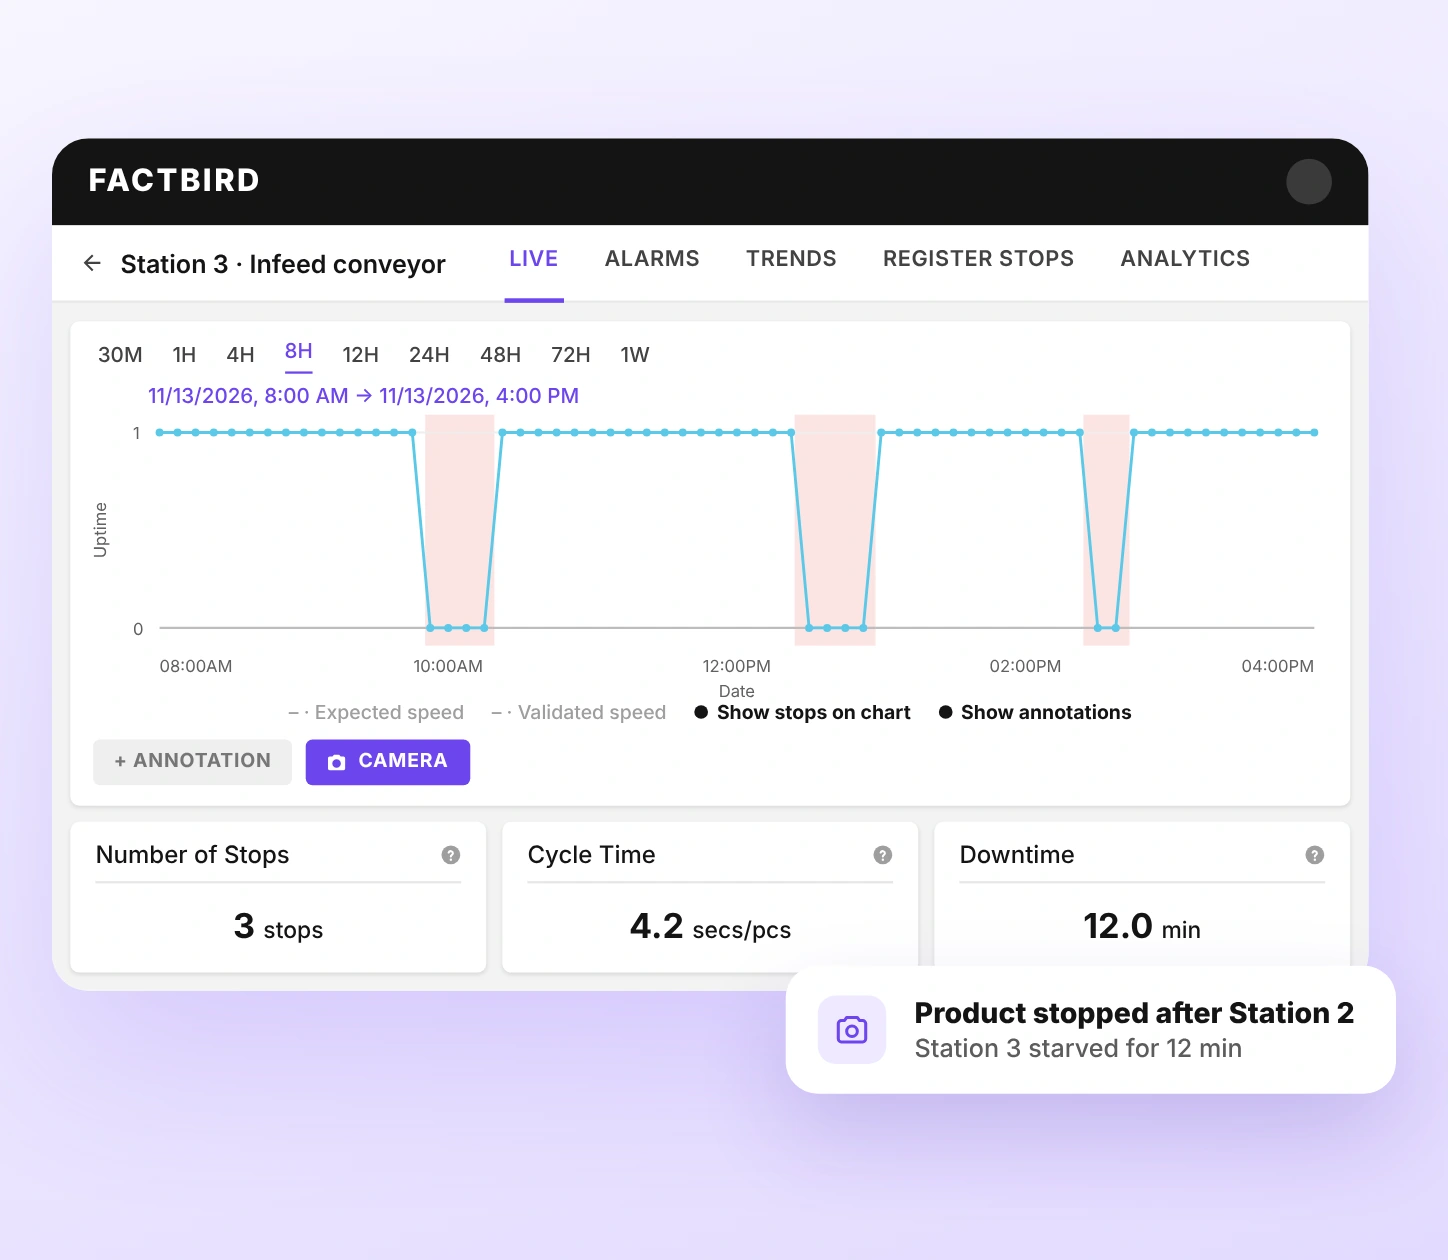
Manual cycle times and starved or blocked stations become numbers that show which steps cost you output.
Get to the root cause faster
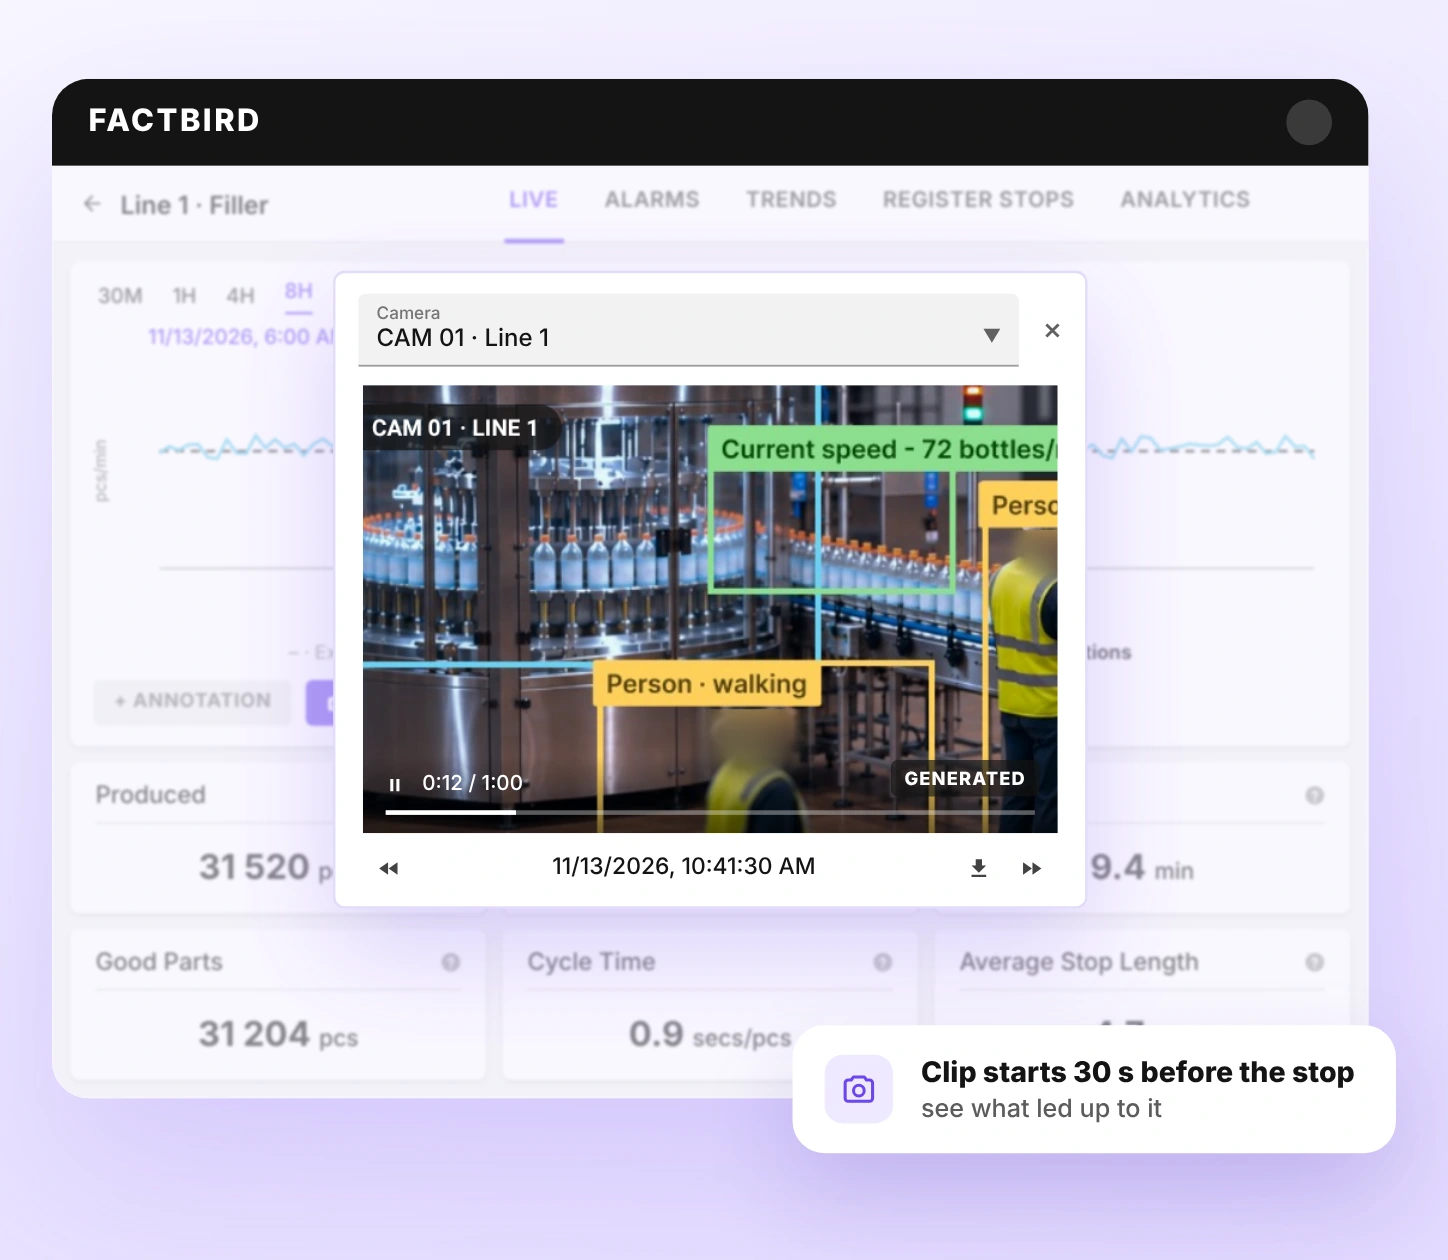
Replay the thirty seconds around every detected event, so nobody has to stand at the station taking notes.
Know which loss to tackle first
See whether to automate a manual step, change the material supply, or rebalance the line, before spending budget on the wrong fix.
How it works
Better understand the reasons behind downtime, speed loss, and scrap
Visual Intelligence adds camera data to Factbird, so you can see how long manual cycles take, when a station runs out of material, and where product backs up on the line.
Use cases
What Visual Intelligence captures
Connected data
Bring visual data into the production view you already use
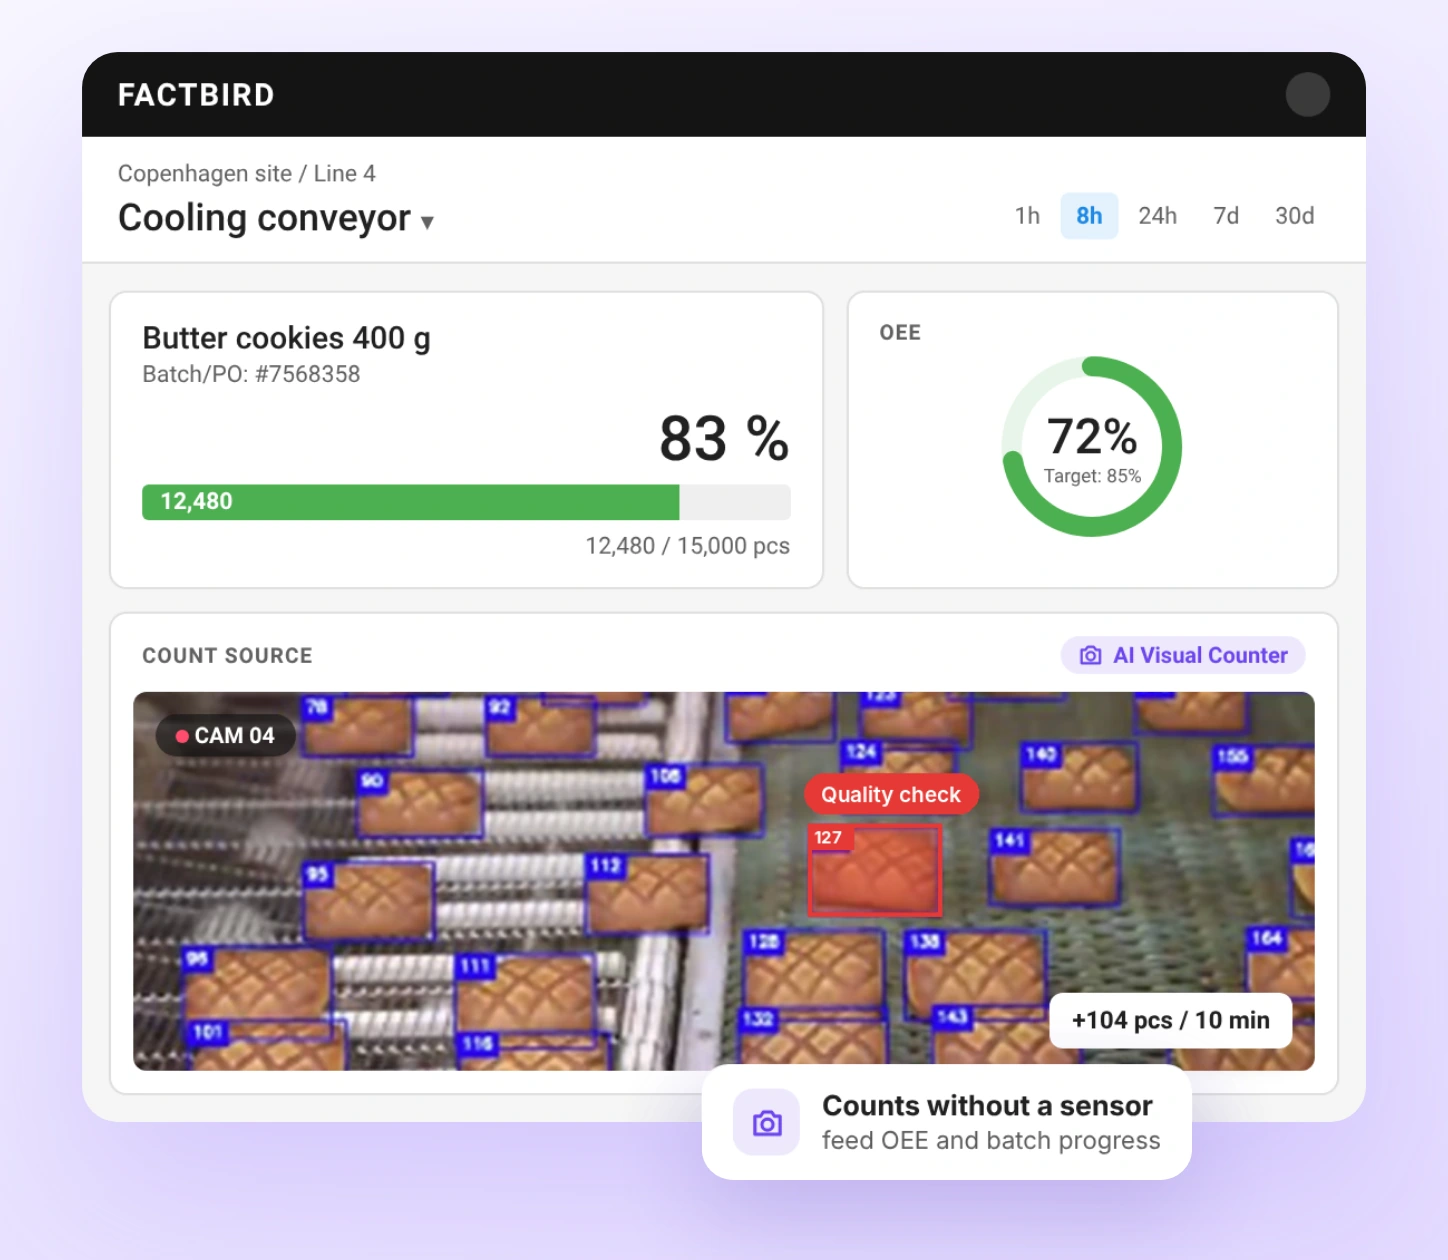
Factbird shows visual signals right next to your downtime, speed loss, performance, and quality check data.
Layers that work together, all around your line
Cameras, edge processing, AI, and the machine data you already have overlap in one platform, so each layer adds context to the others.
Hardware
Factbird® VIEW and Factbird® EDGE
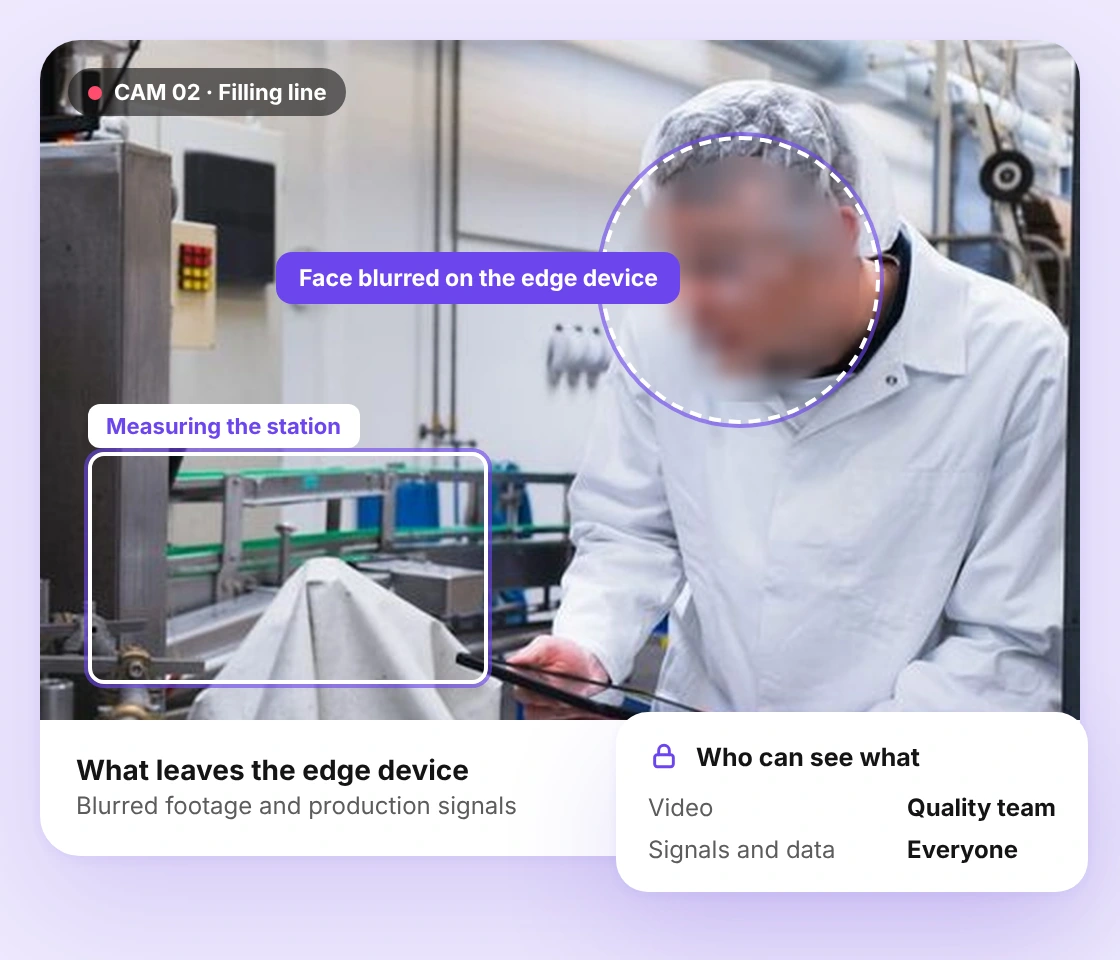
Cameras film the stations and areas you choose. Factbird® EDGE processes on site and blurs faces before any video leaves the device.
AI capability
Visual Intelligence
Turns footage into cycle times, station states, material flow, and product counts.
Platform
Production Insights
Shows it all together in your dashboards, by shift, batch, and product.
What you get with Visual Intelligence
Count irregular products
Count odd-shaped, overlapping, or hard-to-measure products with the AI Visual Counter.
Measure manual or machine cycle times
Measure how long a manual or machine cycle takes by station, person, or robot.
Understand station utilization
See how much of the shift each station is in use and how work moves between stations.
Get insights into machine states
Know when your machines are running, adding value, or waiting.
Detect starved or blocked processes
Detect when a station waits for material or is held up downstream.
Connect video footage to downtime
Review video around detected events to validate what happened around downtime and losses.
Perform product quality checks
Spot visible defects and deviations and do regular quality checks of your products.
View operator interactions
See whether a station was staffed when a cycle ran long or the line slowed down.
Trust and privacy
Designed for trust
Built to measure processes, not people. Here’s how Factbird protects the people on camera.
Processed on the edge
Detections run on the Factbird® EDGE device at the line.
Blur individuals on the device
People can be blurred, or blacked out entirely, before any footage leaves the device. You choose what your site requires.
Permission-based video access
Decide who can review footage and who only sees the resulting data.
Getting started
No big rollout. You start with one station, see the signals in Factbird, and expand from there.
Tell us about the station
A manual process, a recurring speed loss, or a station you can't measure today. We look at it with you.
We plan the application together
Capture method, camera placement, and the privacy and works council requirements that apply at your site.
Signals in Factbird, then expand
The first application goes live in your Factbird view. Add the next station when you see the value.
Visual Intelligence FAQ
Can't find what you're looking for? Browse the guides in the Support Hub, or ask your Factbird contact.
What is Factbird Visual Intelligence?
Factbird Visual Intelligence is an AI capability in the Factbird platform that turns camera footage into production data. It captures what happens on and around your machines, such as manual work, material flow and product counts, and shows it next to your machine data.
What can Factbird Visual Intelligence measure on a production line?
Depending on the application, it produces signals for product counts, cycle time, station utilization, machine state, and starved or blocked conditions, plus video from the moments around an event.
How do you measure manual cycle time automatically?
A camera watches a defined area around the station. Factbird Visual Intelligence detects when a cycle starts and ends, processes the detections on the Factbird EDGE device, and sends the cycle time to Factbird, where you can review it by shift, batch, product, line or site. No stopwatch study needed.
How does it help with bottleneck analysis?
It shows where product stops moving and whether a station is starved (waiting for material) or blocked (held up downstream). Seeing how often that happens, and on which shifts, shows where the real constraint on the line is.
Can it count products without a sensor?
Yes. The camera can count irregular, overlapping, or hard-to-sense products, and you see the counts in Factbird next to your other production data.
Does it show why a line stopped?
It shows the camera clip from the moments before a stop, next to the stop in your machine data. It does not assign the root cause automatically, but it gives your team the context to investigate, and AI highlights events worth looking at first.
Do we have to replace our sensors or PLC connections?
No. Factbird Visual Intelligence sits next to the sensors and PLC connections you already have. You add a camera where context is missing and keep what already works.
How is Factbird Visual Intelligence different from Factbird® VIEW?
Factbird® VIEW gives you video for stops: click a stop and see what happened. Factbird Visual Intelligence uses AI to turn what the camera sees into quantitative signals, such as counts, cycle times and starved or blocked states, for dashboards, analytics and AI tools.
How is the privacy of people on camera protected?
Detections are processed on the edge device at the line. People can be blurred before footage leaves the edge device, and access to video is controlled through Factbird permissions.
Where can I use the data?
In the Factbird views you already use, such as downtime and speed loss, filtered by shift, batch, product or site. Supported signals are also available to Factbird analytics, the AI Assistant and Factbird MCP, so you can ask Claude, ChatGPT, or Copilot in plain language.
See whether Factbird Visual Intelligence fits your line
Tell us about a manual process, a recurring speed loss, or a station you can't measure today, and we'll help you work out whether a camera is the right capture method for it.