AI Report Builder
Build any production report in minutes
Describe the report you need and get instant insights about plant, shift, or line performance.


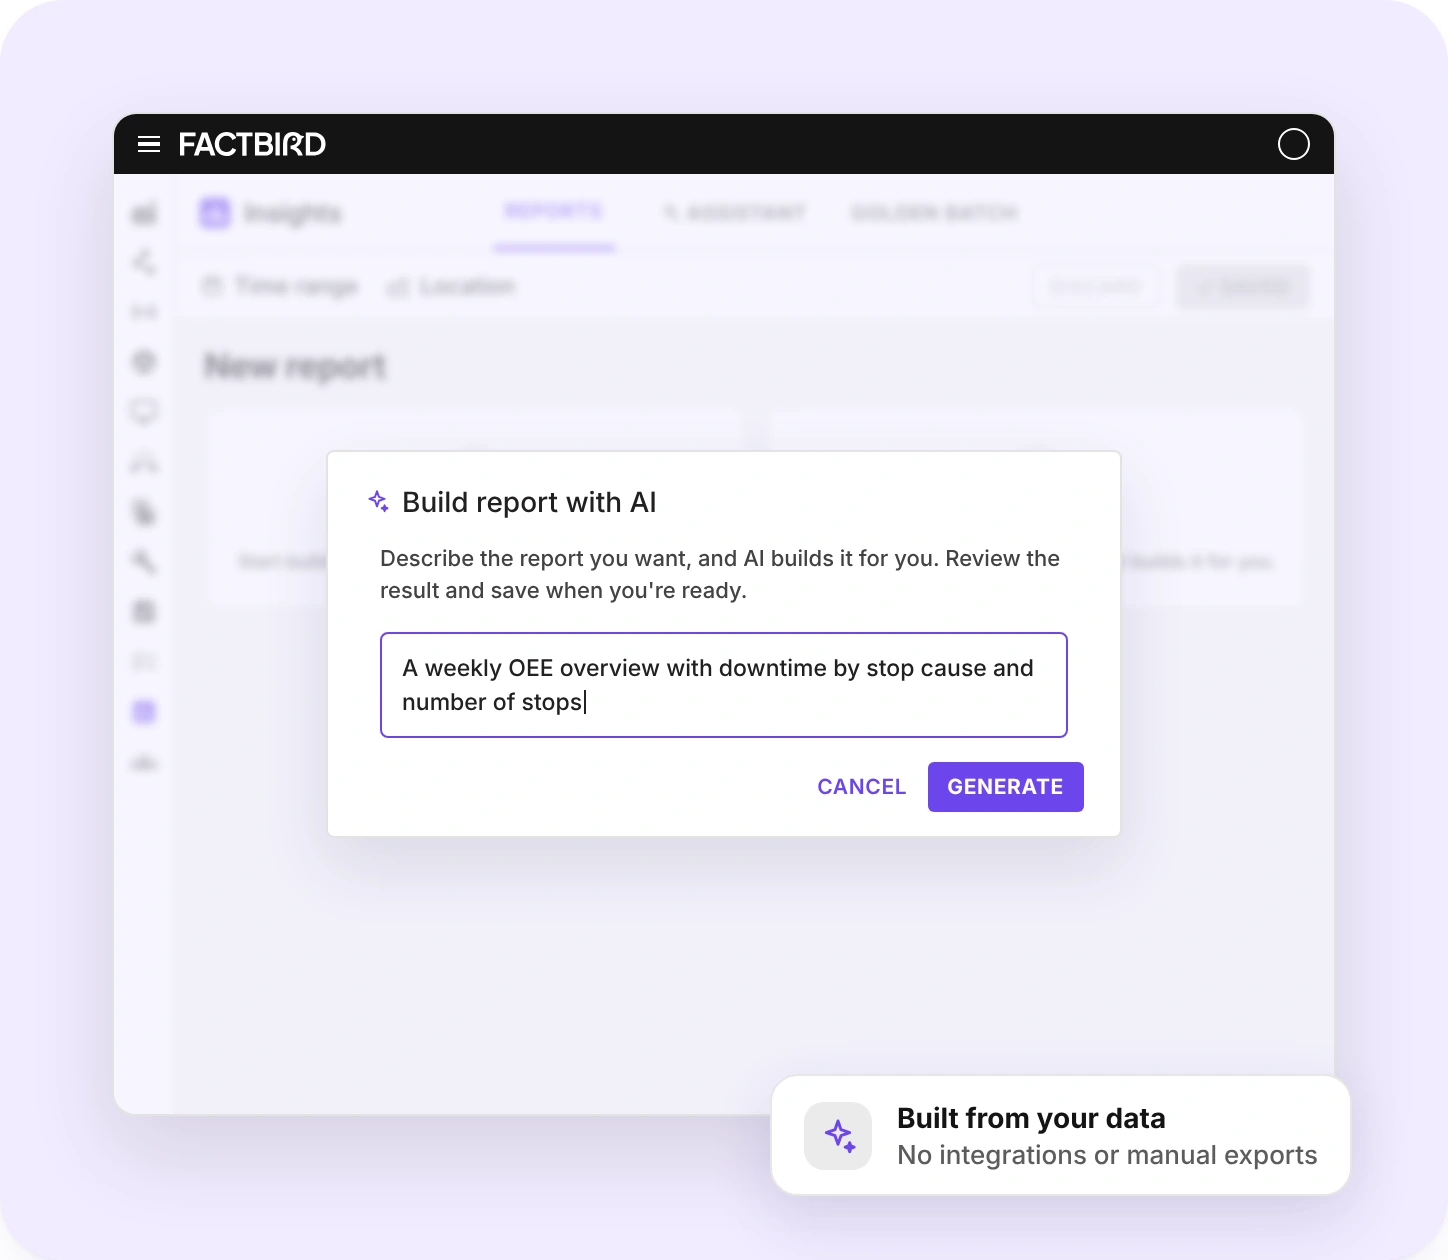
Describe your report, AI builds it
Select and organize widgets yourself, or describe the report you need and let AI create it for you.
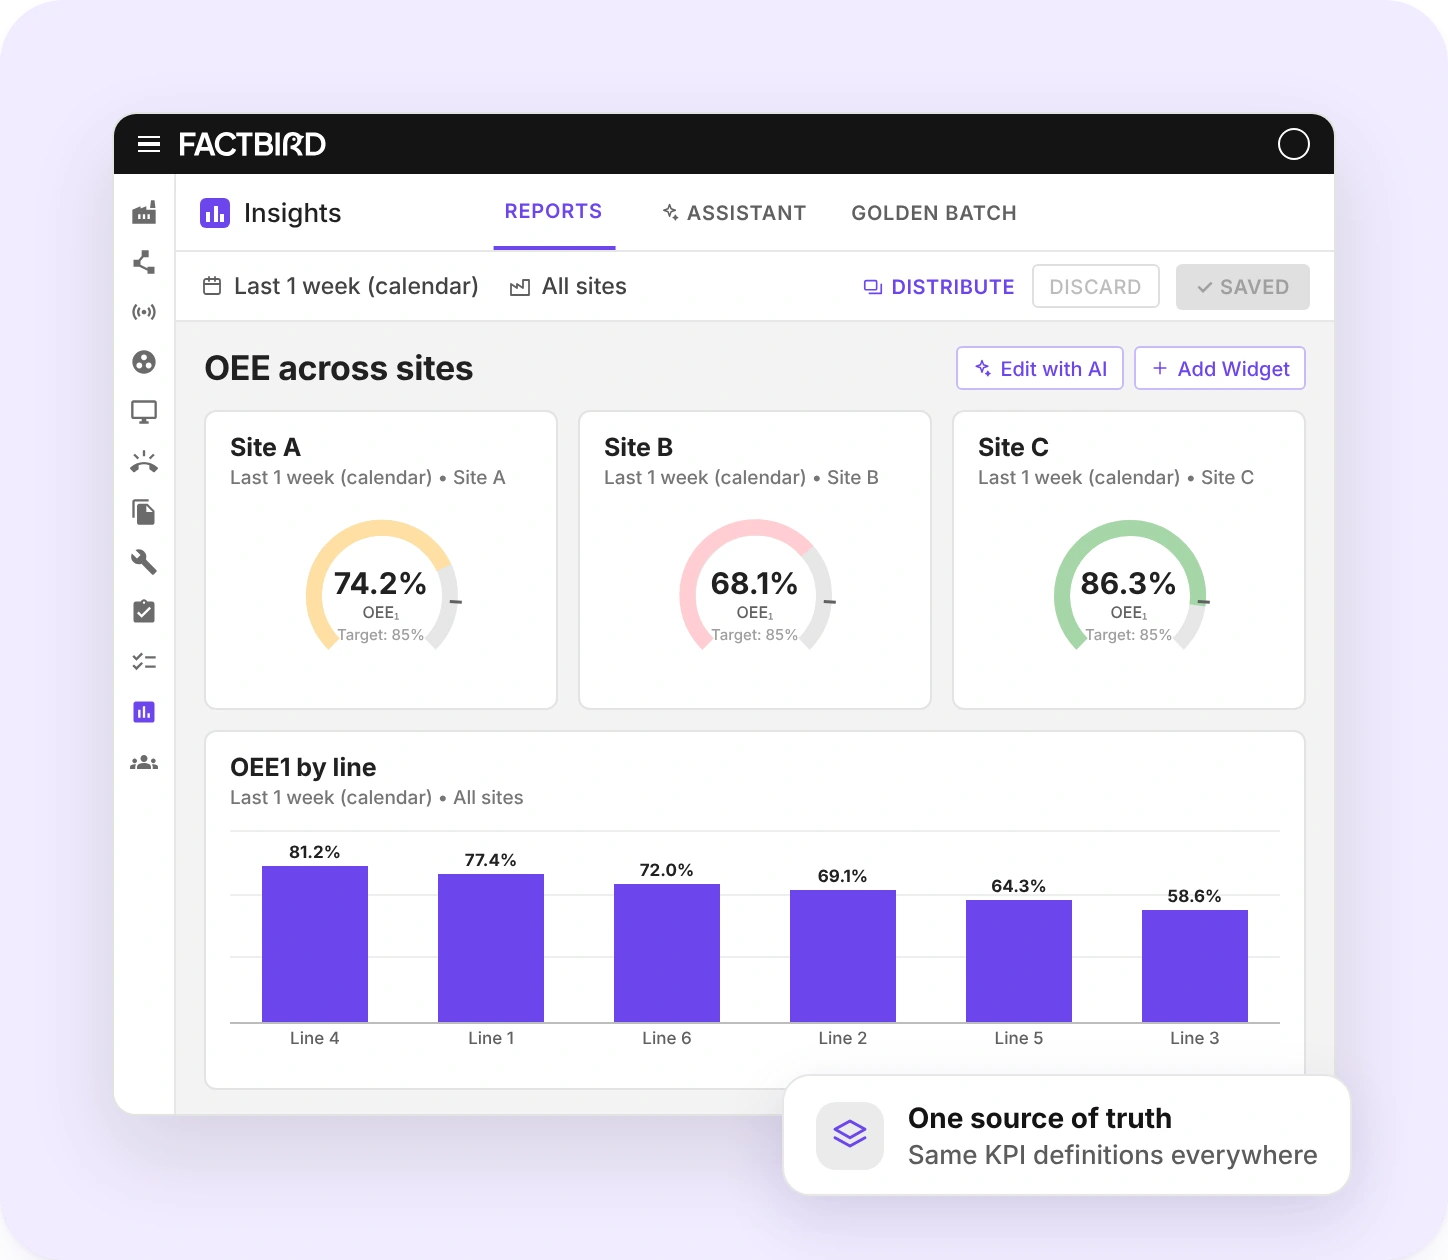
The same numbers on every line and every site
Standardize KPI definitions across every line and site. Compare plants, shifts, and regions against the same metrics, so improvements at one site become the benchmark for everyone.
Without AI Report Builder
With AI Report Builder
AI Report Builder FAQ
Can't find what you're looking for? Follow the step-by-step guide in the Support Hub, or ask your Factbird contact.
What is AI Report Builder?
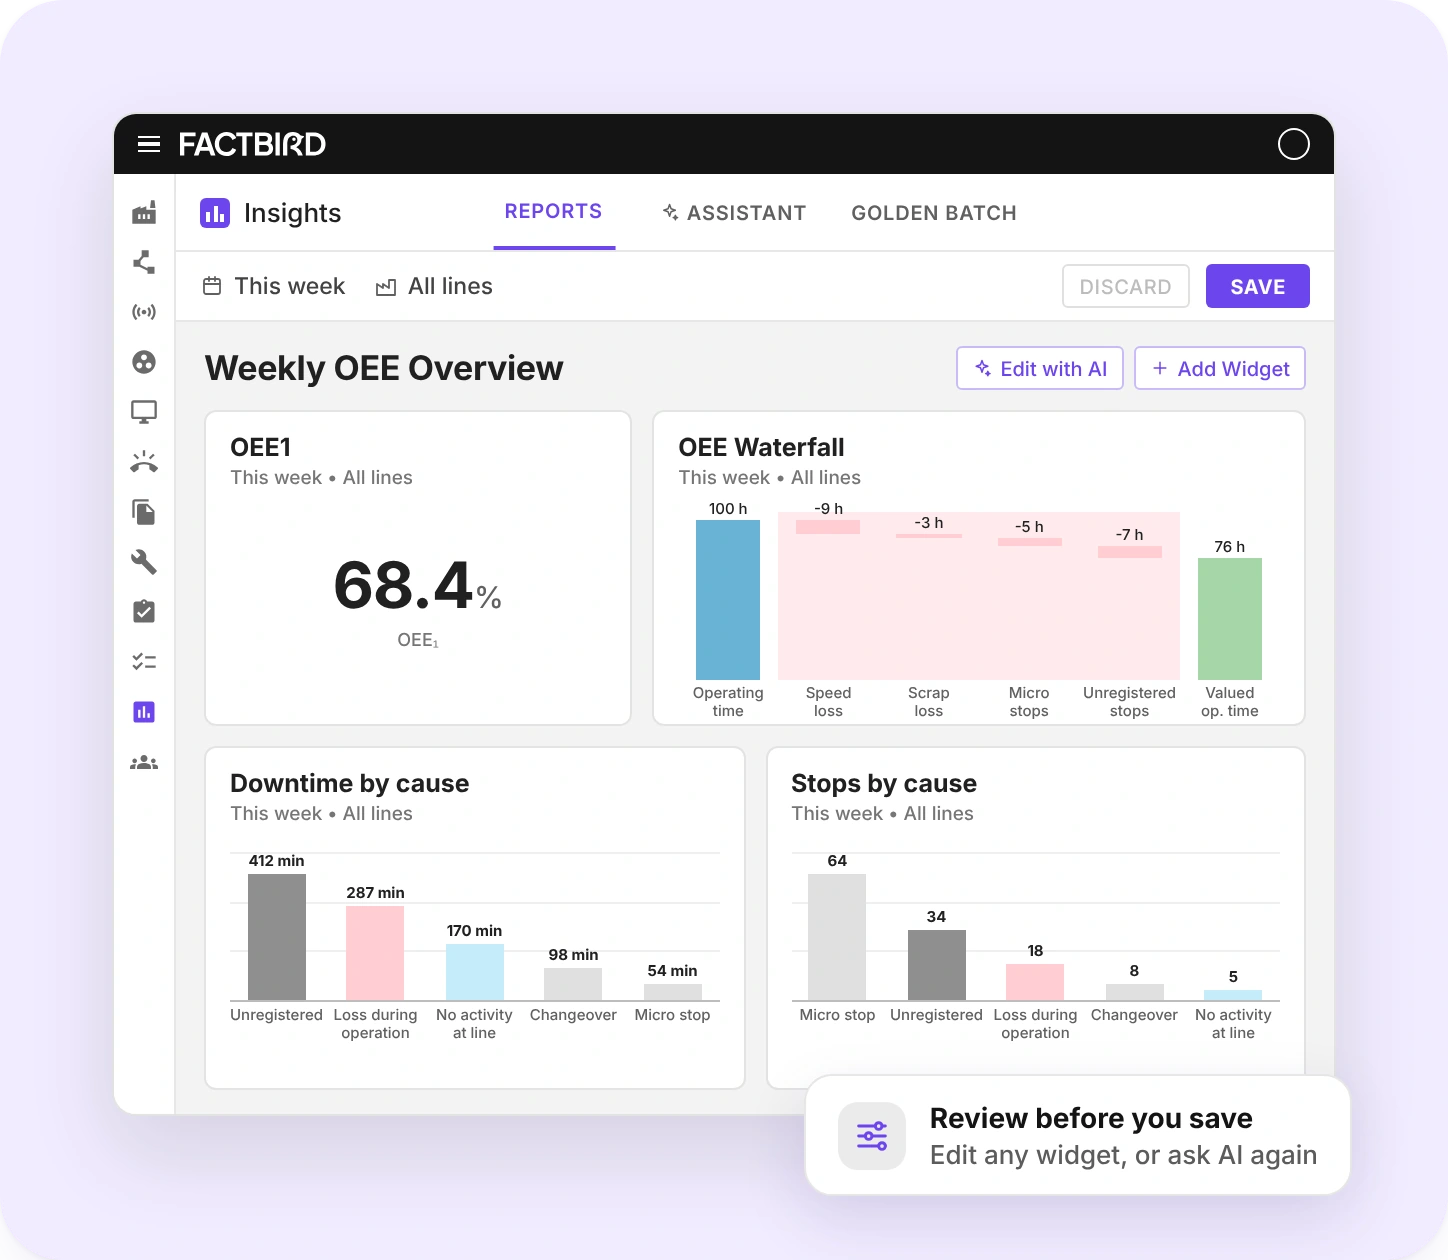
AI Report Builder is the Build with AI option in Factbird Reports. You describe the production report you need in plain language, and AI builds a draft from your production data in Factbird, using the same widgets you would add yourself, such as KPI, gauge, bar, table, and OEE waterfall. You review the draft, adjust it, and save it.
How do I create a report with AI in Factbird?
Open Insights, go to Reports, and create a new report. Choose Build with AI, describe the report you want, for example “A shift report for last week”, and click Generate. Review the result, adjust any widget, and click Save.
Do I need BI tools, coding, or IT support?
No. There is no code, no API, no BI expert needed, and no integrations or manual exports. AI Report Builder works entirely inside Factbird.
Which data does a report use?
AI Report Builder uses the production data already in Factbird, such as OEE, downtime, stops, produced and good parts, and scrap. A report can cover one line, a site, or several sites, for a time range or a specific batch.
Can I edit a report that AI built?
Yes. Run Build with AI again with a more specific description, use Edit with AI to describe a change, or edit, add, and rearrange the widgets yourself. The changes stay in your draft until you click Save.
How are reports delivered?
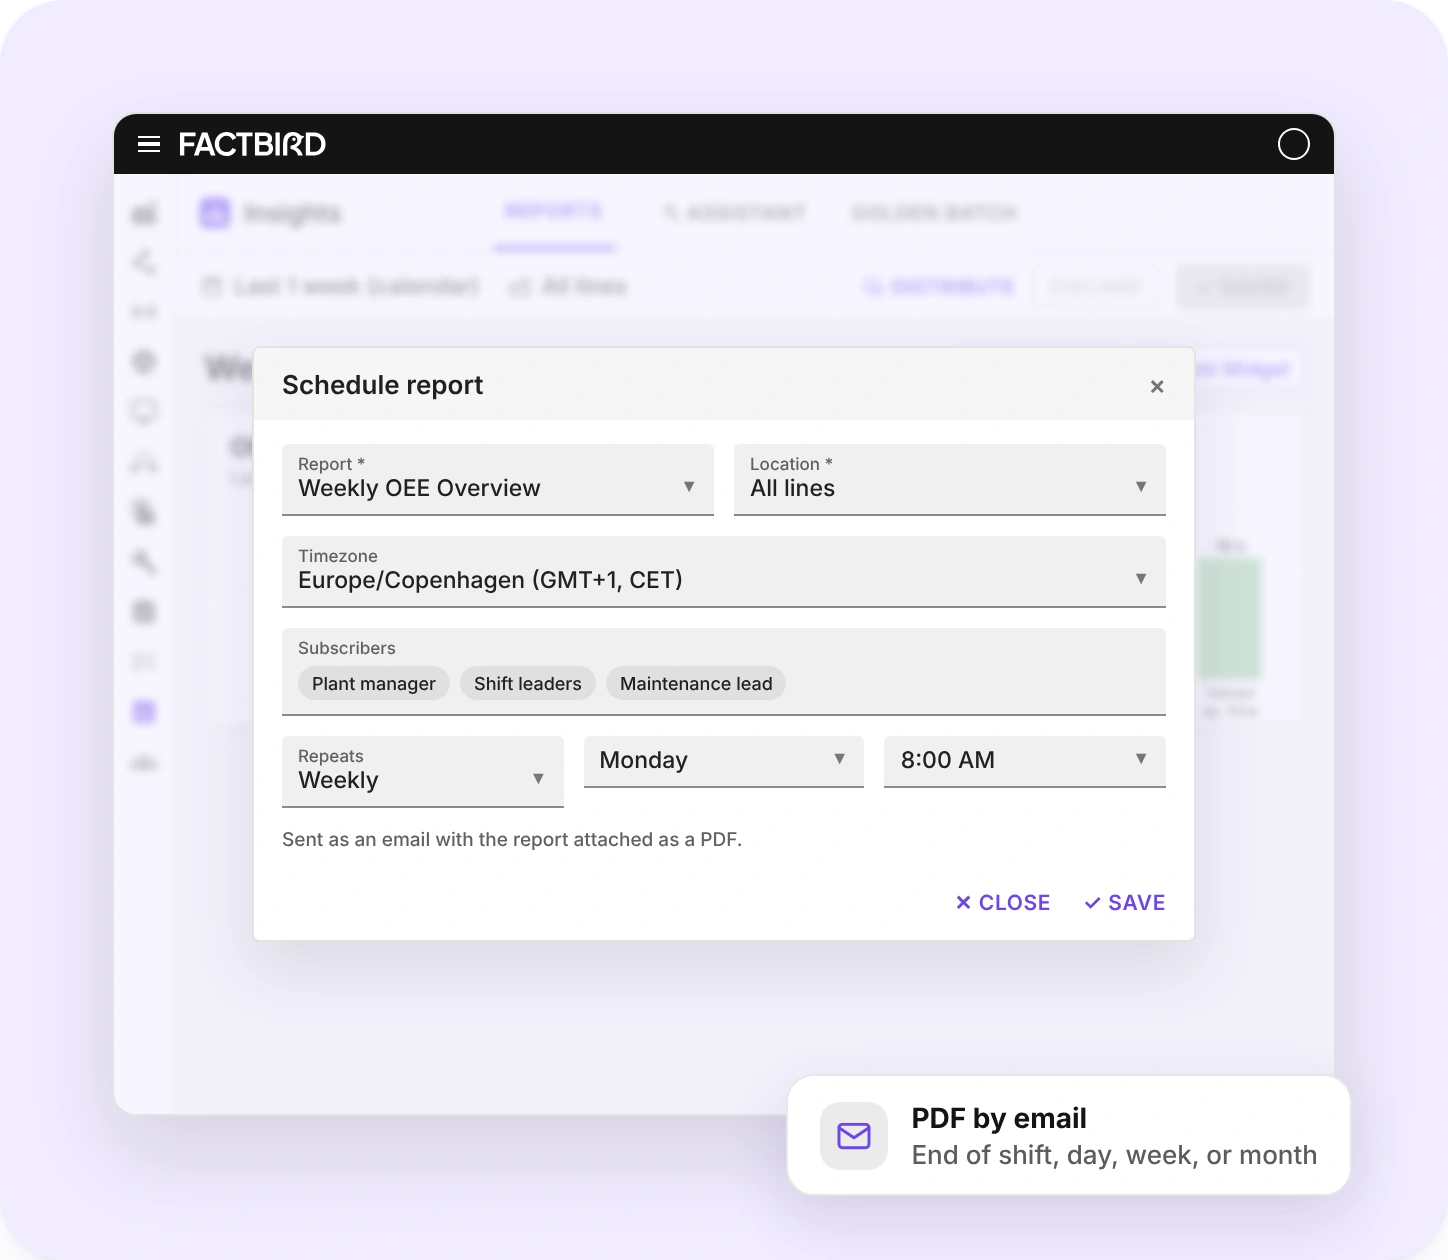
Factbird sends scheduled reports by email with the report attached as a PDF, on the cadence you choose, such as daily, weekly, or monthly. Set the schedule once, and subscribers get the report automatically.
Who can see a report I create?
A new report is private, so only you can see it. You can turn it into a company report, which is shared through location-based permissions, so people only see data for the locations they have access to. Company reports can also be shown in Factory Overview and the line view.
Can I compare lines and sites in one report?
Yes. KPI definitions are standardized across every line and site in Factbird, so one report can compare plants, shifts, and regions against the same metrics.
Who are the reports for?
Anyone who needs production numbers. Shift leaders get a summary the moment the shift ends, plant managers a weekly view across all lines, and leadership a single view of OEE, throughput, and losses across all sites.
No more manual reporting. Ever.
Pick the KPIs that matter most, build your report, and shift leaders, plant managers, and executives get it delivered automatically.
Any lines, any sites. You pick.