Operational excellence guide
This guide will take you through our 6 steps to help you unlock the full potential of your equipment and drive your operational excellence.
Step 1 - Track Flow
Start by attaching a sensor to the bottleneck area of your production line, which will count and timestamp the flow of products. Upon connecting the sensor, the live data will be displayed within the Factbird application.
.webp)
From that single data point, you can gain a deeper understanding of your production process.
- When did we start and finish
- How much have we produced
- How much value adding time
- How many stops and how much downtime
- Average stop time
- Longest non-stop
- Product cycle time (speed)
Many of these KPIs can be viewed directly under the live production graph.

Next, you'll want to examine the progression of these KPIs over time. To do this, simply click on any KPI, which will direct you to a trend analysis, allowing you to gain a deeper understanding of the KPI's trajectory.

Step 2 - Track Stop Reasons
This step aims to uncover the underlying causes behind equipment underperformance.
Whenever the production line comes to a halt, you can track the duration of the stop and inquire about the reason from the operator, or, where possible, extract the stop cause directly from the machine’s PLC.
These stop causes are then grouped into the four primary OEE categories.
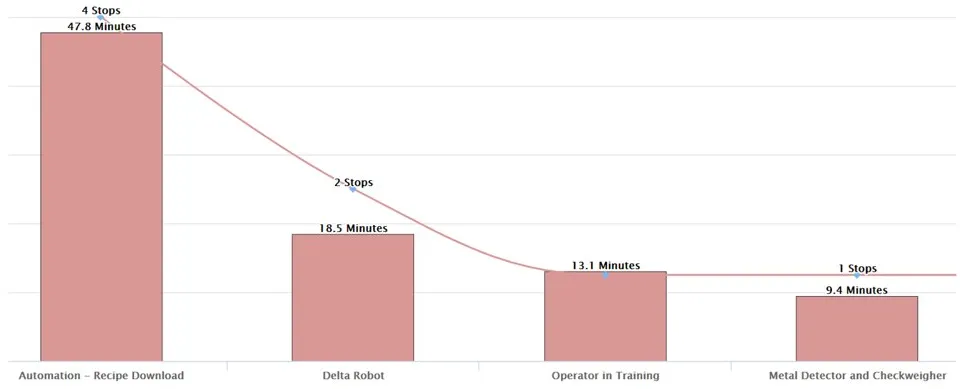
By tracking the reasons for stoppages, a wealth of data becomes available:
- Reason and duration for every stop on the line 24/7/365
- The time spent on technical stoppages, change-overs, breaks, repair, etc.
- Pareto chart showing what to improve in prioritized order
- Operator comment to stops to provide additional context
- Visualization of individual stop causes over time
On the analytics page, users can deep dive into the most significant contributors to downtime per shift, day, week, month etc.
During continuous improvement meetings with operators and technicians, we recommend focusing on the top 3-5 stop causes. Utilize the scatter plot in analytics to assess whether the measures taken have had the desired effect.

Step 3: Set Shift & Batch Targets - Performance Tracking
To achieve real-time performance tracking, it's important to establish targets for line performance that are realistic and based on the best-observed line performance.
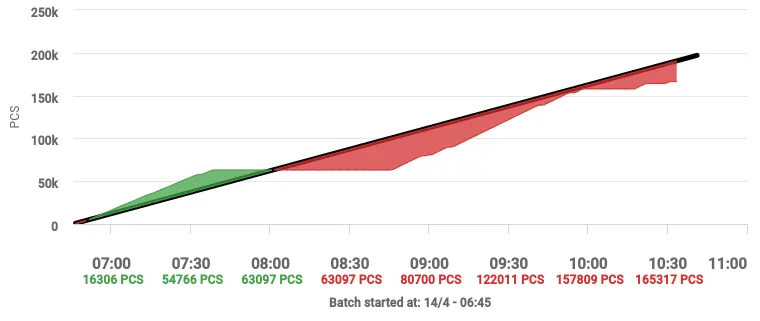
Begin by setting the validated and expected speed for the line in the sensor settings. This allows you to identify if the line is operating at full speed or, as in the example below, underperforming due to speed loss.
When running multiple products on the same line with varying targets, the batch feature can be used to set product-specific targets. The following KPIs can be tracked through batch tracking:
- Cycle time per product
- Duration time for different batch sizes per product
- Time loss data for technical stops, speed loss, change-over activities and non-production related activities per product
Targets can also be set for each OEE category to create high-level and summarized KPIs. These are often used to compare different line performance or consolidate a manufacturing area performance.

We highly encourage to encourage factory floor operators and technicians to engage with performance and targets.
Real-time performance insights can foster behavioural change and create a sense of ownership on the factory floor. That's why we created the Batch Dashboard, a visual representation of line performance designed to be displayed on large screens around the line, allowing everyone to see instantly if the line is ahead or behind schedule.
Step 4: Monitor process performance, rejects and defects
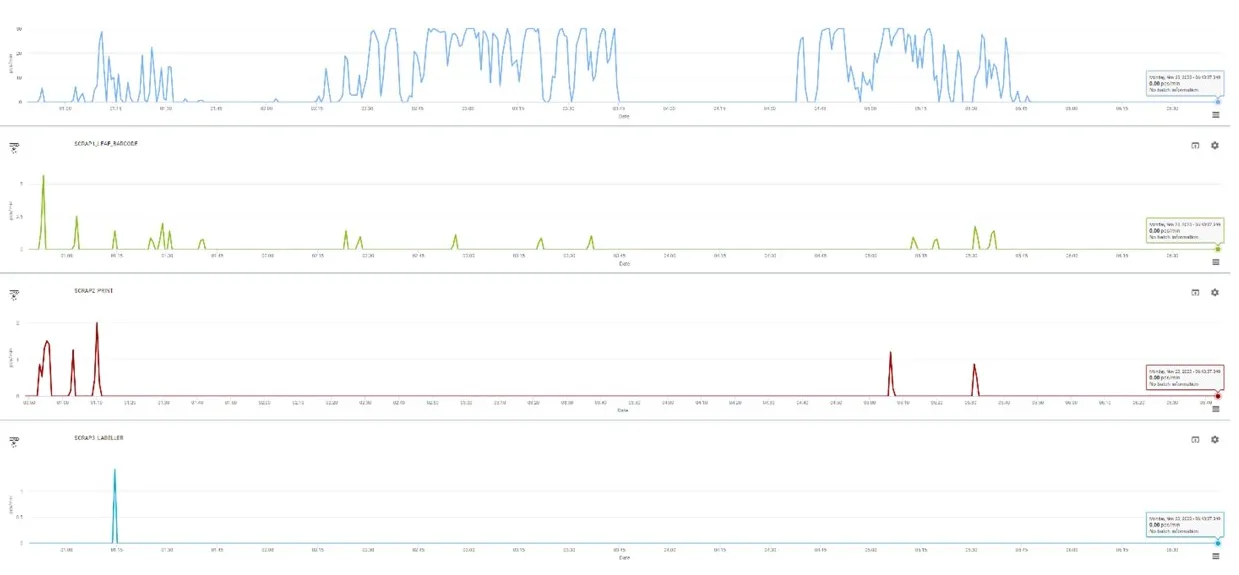
Process performance is critical for maintaining a high-quality output. By monitoring rejects and defects, you can identify whether the process is under control or not. With Factbird, you can add sensors to count rejects on the line and register defects on the batch, allowing you to track process performance at a granular level.
At this level, you can track process performance by monitoring defects and rejects per product or batch.
Step 5: Automate predictive and preventive maintenance
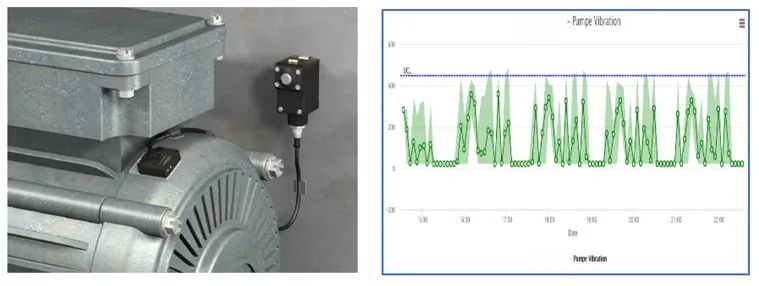
Sensors are a powerful tool for monitoring critical equipment and detecting potential issues before they become problems. With Factbird, you can place sensors on critical equipment to track parameters and detect unwanted variations that could lead to failure. For example, you can set up a vibration alarm on a CIP pump to detect abnormal vibrations.
We commonly see sensors on electrical motors, pumps, and conveyor belts, making it easy to monitor equipment wear and tear. By correlating this data with manufacturing output, you can establish a baseline and identify early warning signs of potential issues.
Step 6: Build intelligence in with control charts and forecasting
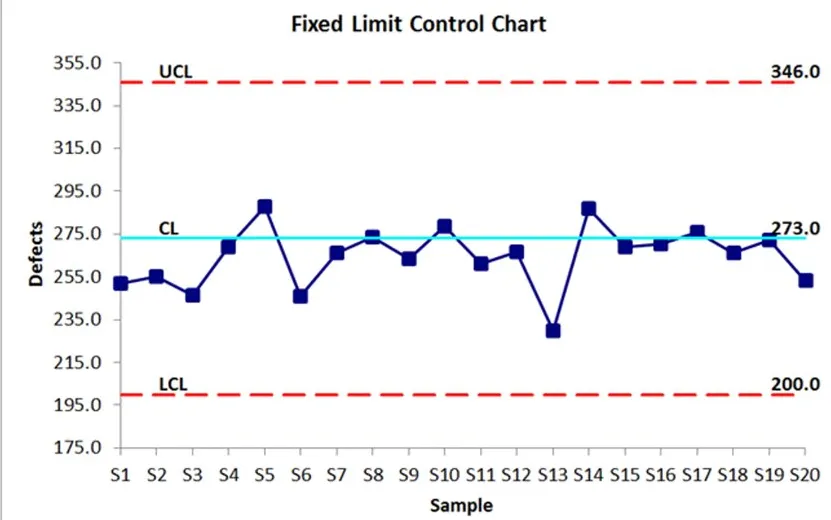
Process parameters such as temperature and humidity can significantly impact process performance. By collecting and correlating this data with line performance and quality, you can identify optimal setpoints and control limits.
Factbird can give early warnings when setting up a control limit to warn and notify when a parameter is starting to slip outside the limits.
With Factbird, you can experiment with different parameters and use control charts and forecasting to improve your processes and gain a competitive advantage.
See how you can achieve operational excellence with Factbird

.png)