Downtime in manufacturing: what it is and how to reduce it
Learn what downtime in manufacturing is, how to calculate it, and proven ways to reduce it, including examples, formulas, and a practical categorization guide.


Unplanned downtime can cost you hundreds of thousands of dollars per hour, yet most factories still struggle to capture what’s actually causing it.
The filler keeps stopping. Operators blame the labeler. Maintenance blames the conveyor. Each team logs something different: "film change," "roll swap," or "material infeed."
Management wants to cut downtime, but with inconsistent data, no one really knows what’s happening.
The following is a quick primer on downtime in manufacturing: what it is, how to track it, how to categorize it (including the easy-to-remember DOWNTIME acronym), and Factbird’s popular stop-cause categorization guide.
What is downtime in manufacturing?
Downtime in manufacturing is any period when a line, cell, or asset is not producing saleable product at the intended rate. Capturing downtime, sometimes called waste or loss, includes:
- Product loss: rework, scrap
- Time loss: long changeovers, no production on the line, micro stops
- Speed loss: running below maximum verified speed
- Utility overuse: excess water, steam, gas, power tied to stoppages or inefficiency
Sustainability goals and cost pressure are driving manufacturing leadership to put downtime capture front and center.
Change and improvement champions are looking for low-lift, scalable tools that bring visibility and quantify losses, without a full-blown digital transformation. That demand is why Factbird has built a successful business helping manufacturers identify downtime and improve the productivity of their people, assets, and processes.
Take the food and beverage industry, for example. Margins are tight, machines are often legacy, and inefficiency piles up, especially at end-of-line packaging. Think runtime/downtime tracking on fillers, shift- and batch-based performance, bottlenecks around labeling or palletizing, and loss events tied to utility disruptions.
How to calculate downtime (with a quick formula)
At its simplest:
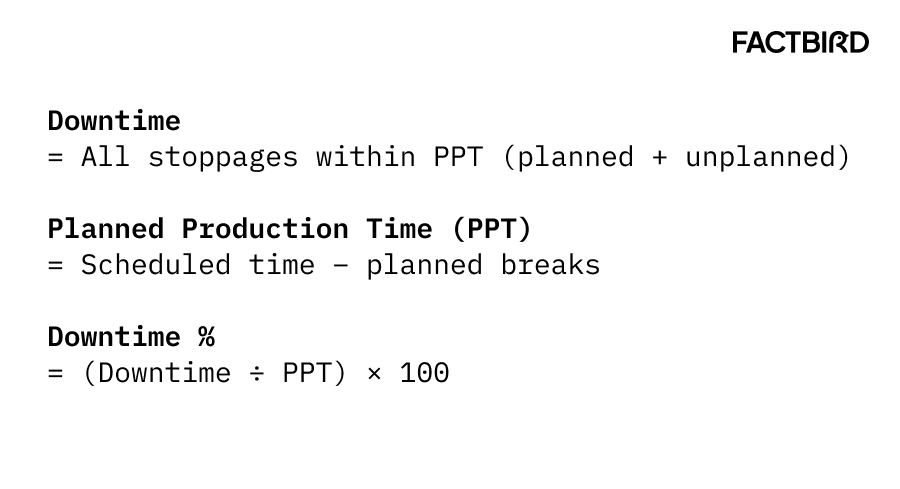
- Planned Production Time (PPT) = Scheduled time − planned breaks
- Downtime = All stoppages within PPT (planned + unplanned)
- Run Time = PPT − Downtime
From there:
- Downtime % = (Downtime ÷ PPT) × 100
- Availability = Run Time ÷ PPT
- OEE = Availability × Performance × Quality
Example:
A line is scheduled for 480 minutes with 40 minutes of planned breaks.
PPT = 440 minutes
Downtime events total 80 minutes; therefore, Downtime % = 80/440 = 18.2%
Run Time = 360 minutes; therefore, Availability = 360/440 = 81.8%
If Performance = 92% and Quality = 98%, then OEE = 0.818 × 0.92 × 0.98 = 73.7%
Planned vs. unplanned downtime
- Planned: changeovers, sanitation, preventive maintenance
- Unplanned: breakdowns, material shortages, micro-stops, etc.
Both planned and unplanned downtime should be captured. Planned activities help explain lost capacity and are vital for improving overall productivity.
How to capture downtime
The production monitoring and analytics journey is varied. Some teams go high-tech; others need quick wins on people and process to keep the business running.
No matter your starting point, begin by getting visibility into what’s causing downtime in your factories.
Start with people and processes.
People are the biggest barrier to change in manufacturing, and the importance of getting early input and buy-in from teams is often neglected. Map current processes and gather input from operators and technicians, they already know many of the answers.
Capture the right data in real time.
Identify what information you need to reach your goals, then begin tracking that data. You can start manually with spreadsheets, but manual entry won’t produce the accurate, real-time data you need for improvement. We suggest automatically capturing downtime events using IIoT edge solutions such as the Factbird® DUO, integrating with tools like Kepware, or directly utilizing PLC tags.
Standardize categorization at the operator interface.
Guide operators to follow a simple, consistent stop-cause taxonomy. Factbird’s Operator View streamlines day-to-day categorization, improves data accuracy, gives real-time visibility, and helps teams achieve better results from improvement activities. You can read more about how Factbird categorizes stop causes later on in this article.
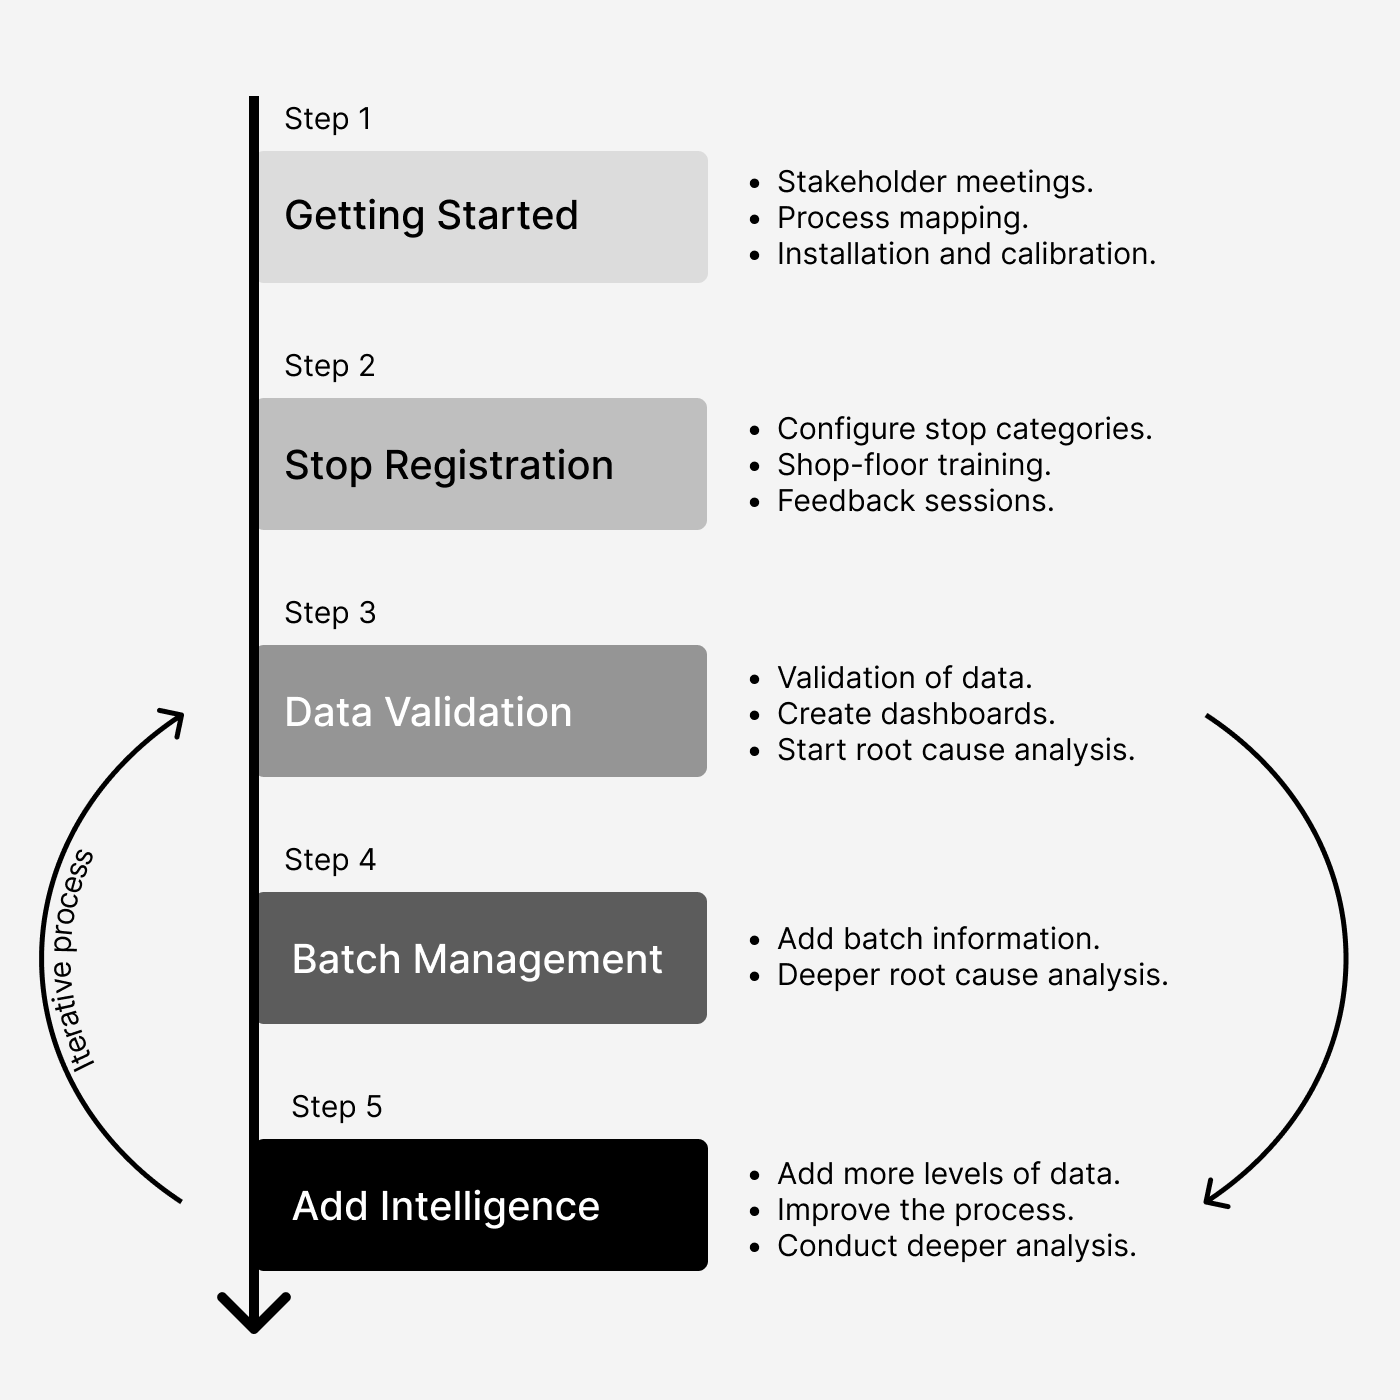
If you’d like to learn how to roll out an efficient downtime capture system, watch our academy lesson on the Highway Solution: Five-step OEE implementation strategy. It’s a practical framework for implementing OEE across multiple sites based on the real experience of Mikkel Rauff Simonsen at Danish Crown.
The DOWNTIME acronym in lean manufacturing
Let's delve into the specifics of categorizing downtime. One popular model is the DOWNTIME acronym.
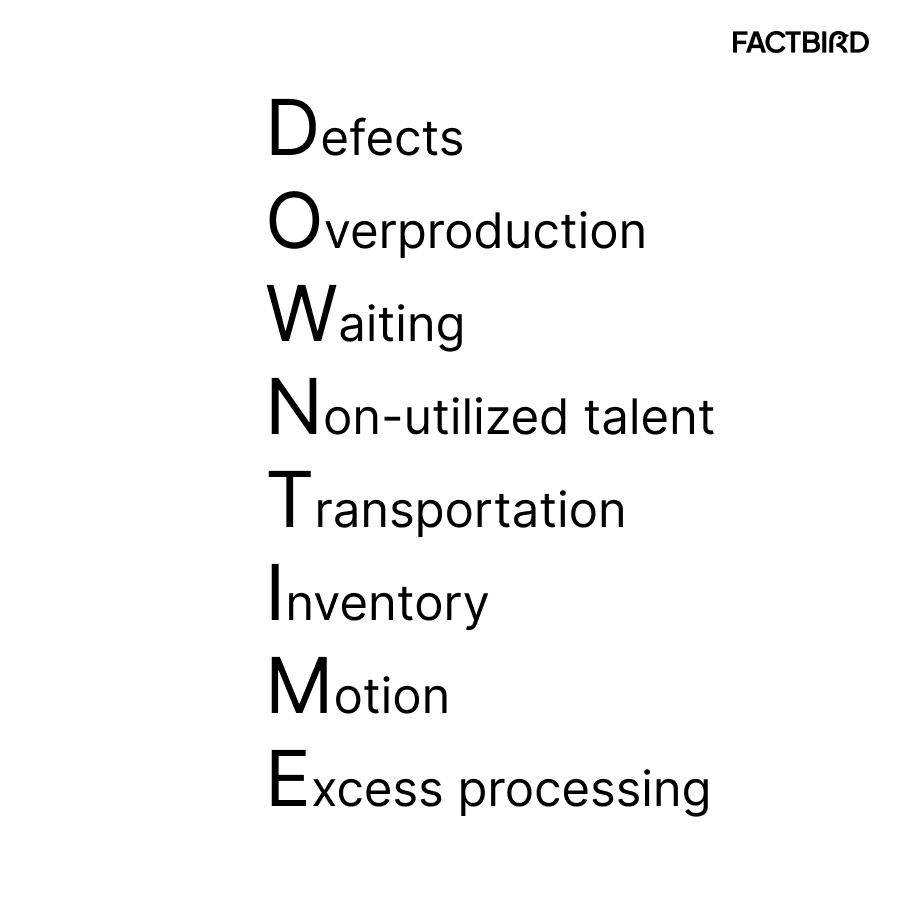
The acronym DOWNTIME stands for the eight forms of "waste" (or muda) in lean manufacturing:
- Defects
- Overproduction
- Waiting
- Non-utilized talent
- Transportation
- Inventory
- Motion
- Excess processing
Developed from the Toyota Production System, this framework helps identify inefficiencies in a process and increases productivity and value for the customer.
Here's a quick guide for what each element of the DOWNTIME acronym stands for:
Defects: Rework, scrap, or incorrect information that requires corrective effort.
Overproduction: Creating more of a product or service than is needed, which can lead to wasted resources.
Waiting: Delays in a process that result in idle parts, people, or information.
Non-utilized talent: Failing to use an employee's skills, knowledge, and potential.
Transportation: Unnecessary movement of materials, products, or equipment from one place to another.
Inventory: Excess materials or products not being processed, leading to increased storage costs and potential spoilage.
Motion: Unnecessary movement of people, such as operators having to move long distances to restock packaging material or perform an action during production.
Excess processing: Performing work that doesn't add value to the end-customer, such as "gold-plating" or excessive processing.
Now that you understand the famous DOWNTIME acronym, let’s take a look at how Factbird’s customers typically categorize stops.
Factbird’s downtime categorization guide
Downtime data only helps if it’s consistent. If operators use different names for the same issue or skip logging the cause, it’s hard to know what’s really happening. That’s why we help teams use a simple, shared list of stop reasons right at the operator screen. It makes the data more accurate, easier to understand, and more useful for spotting patterns and making improvements.
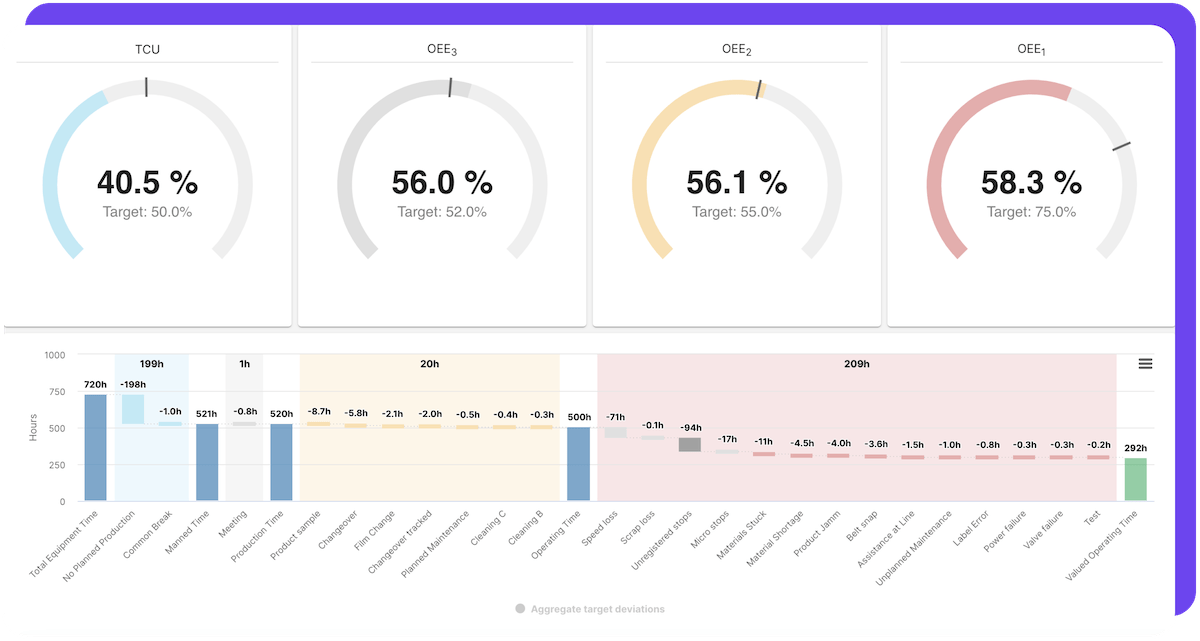
There are multiple ways to categorize the various types of downtime. When analyzing OEE at Factbird, we begin by categorizing stop causes into OEE1, OEE2, OEE3, and TCU.
OEE 1: Loss during operation
Your OEE 1 score is associated with the time that the production line is scheduled to be running. In an ideal world, your OEE 1 score would be 100%, meaning that the line would simply be running at its full, validated speed.
Several unplanned circumstances can, however, cause the line to stop or run slower than expected. Below are some examples of downtime, or stop causes, that negatively affect your OEE 1 score.
Machine defects
- Malfunction of a machine
- Reset or reboot of a machine
Process Defects
- Purchase order (PO) missing
- Work order missing
- Missing material
- Machine jam
- Breakage of material
- Print fault
Waiting
- Consulting an expert
- Waiting for an operator
- Waiting for material
- Waiting for maintenance
- Maintenance in-progress
Utilities
- Power cut
- Gas cut
IT
- Computer down
- Network issue
Cleaning
- Cleaning after breakage
- Cleaning after spill
OEE 2: Loss during batch changeover
Your OEE 2 score is associated with the time that your production line is not running due to batch changeovers. Unlike OEE 1 stops, OEE 2 stops are planned in nature, meaning that it is anticipated that the line will regularly stop for changeover activities between batches. Below are some examples of OEE 2 activity categories and specific stop causes:
Batch Changeover
- Preparation of a machine
- Retooling of a machine
- Quality check
- Start-up time
Resupply
- Resupply of a product
- Resupply of labels
- Resupply of packaging
Cleaning
- Cleaning at the end of a batch
- Weekly cleaning
OEE 3: Loss due to non-production activities
Your OEE 3 score is associated with the time that the production line is not running due to other activities. Similar to OEE 2, these stops are planned in nature, meaning that it is anticipated that the line will regularly stop for these activities to be performed. Below are some examples of OEE 3 activity categories and specific stop causes.
Planned maintenance
- Preventive maintenance based on units produced or cycles
- Auto-maintenance
Validation
- Performing a validation test
Personnel Activities
- Break
- Team meetings
- New operator training
- Other training activities
TCU: No activity at line
Finally, your total capacity utilization (TCU) score is associated with the time that the production line is not running because there is no activity at the line. These stops are also planned in nature, meaning that it is anticipated that the line will not run during these periods of time. Below are some examples of specific TCU stop causes.
No activity at line
- Weekend
- Holiday
- Non-production time
Guide on how to create stop causes in Factbird
It's easy to classify stops to match your organizations needs and preference in Factbird.
Here's a short tutorial on how to set up stop causes and categories:
You can find this short lesson and more in our How to use Factbird academy course.
Don’t sleep on downtime
Inefficiency resulting from downtime eats into margins and makes your business less competitive. Don’t sleep on accurately tracking and understanding the causes of your downtime.
Make sure you are getting useful downtime numbers, even if by hand using Excel at first. To give you a start, you can download our free Excel template for calculating OEE via our popular lesson on how to calculate OEE:
We all know that acting on hunches is not a way to run a successful project or business, so get started today if you don’t know what is happening on your lines right now, and get in touch with a company like Factbird to get accurate, real-time insights into your production so you can improve.
Would you like help capturing and reducing downtime in your factory? Let’s talk. We’ll walk you through it.
