A rising OEE score can keep a growing cost problem hidden
OEE tells you how well your plant is running, but not what closing that gap is actually worth in revenue, labor costs, or capacity.

Most finance discussions in manufacturing treat OEE as an operations metric. It’s simply something to glance at in the monthly reports before moving on to inventory and margin. That's a mistake, and it can be an expensive one.
OEE is one of the few production numbers that translates directly into the two things finance cares about most: the cost of running the plant, and the revenue left on the table by not running it better.
The catch is that the headline number alone won't tell you either of those things.
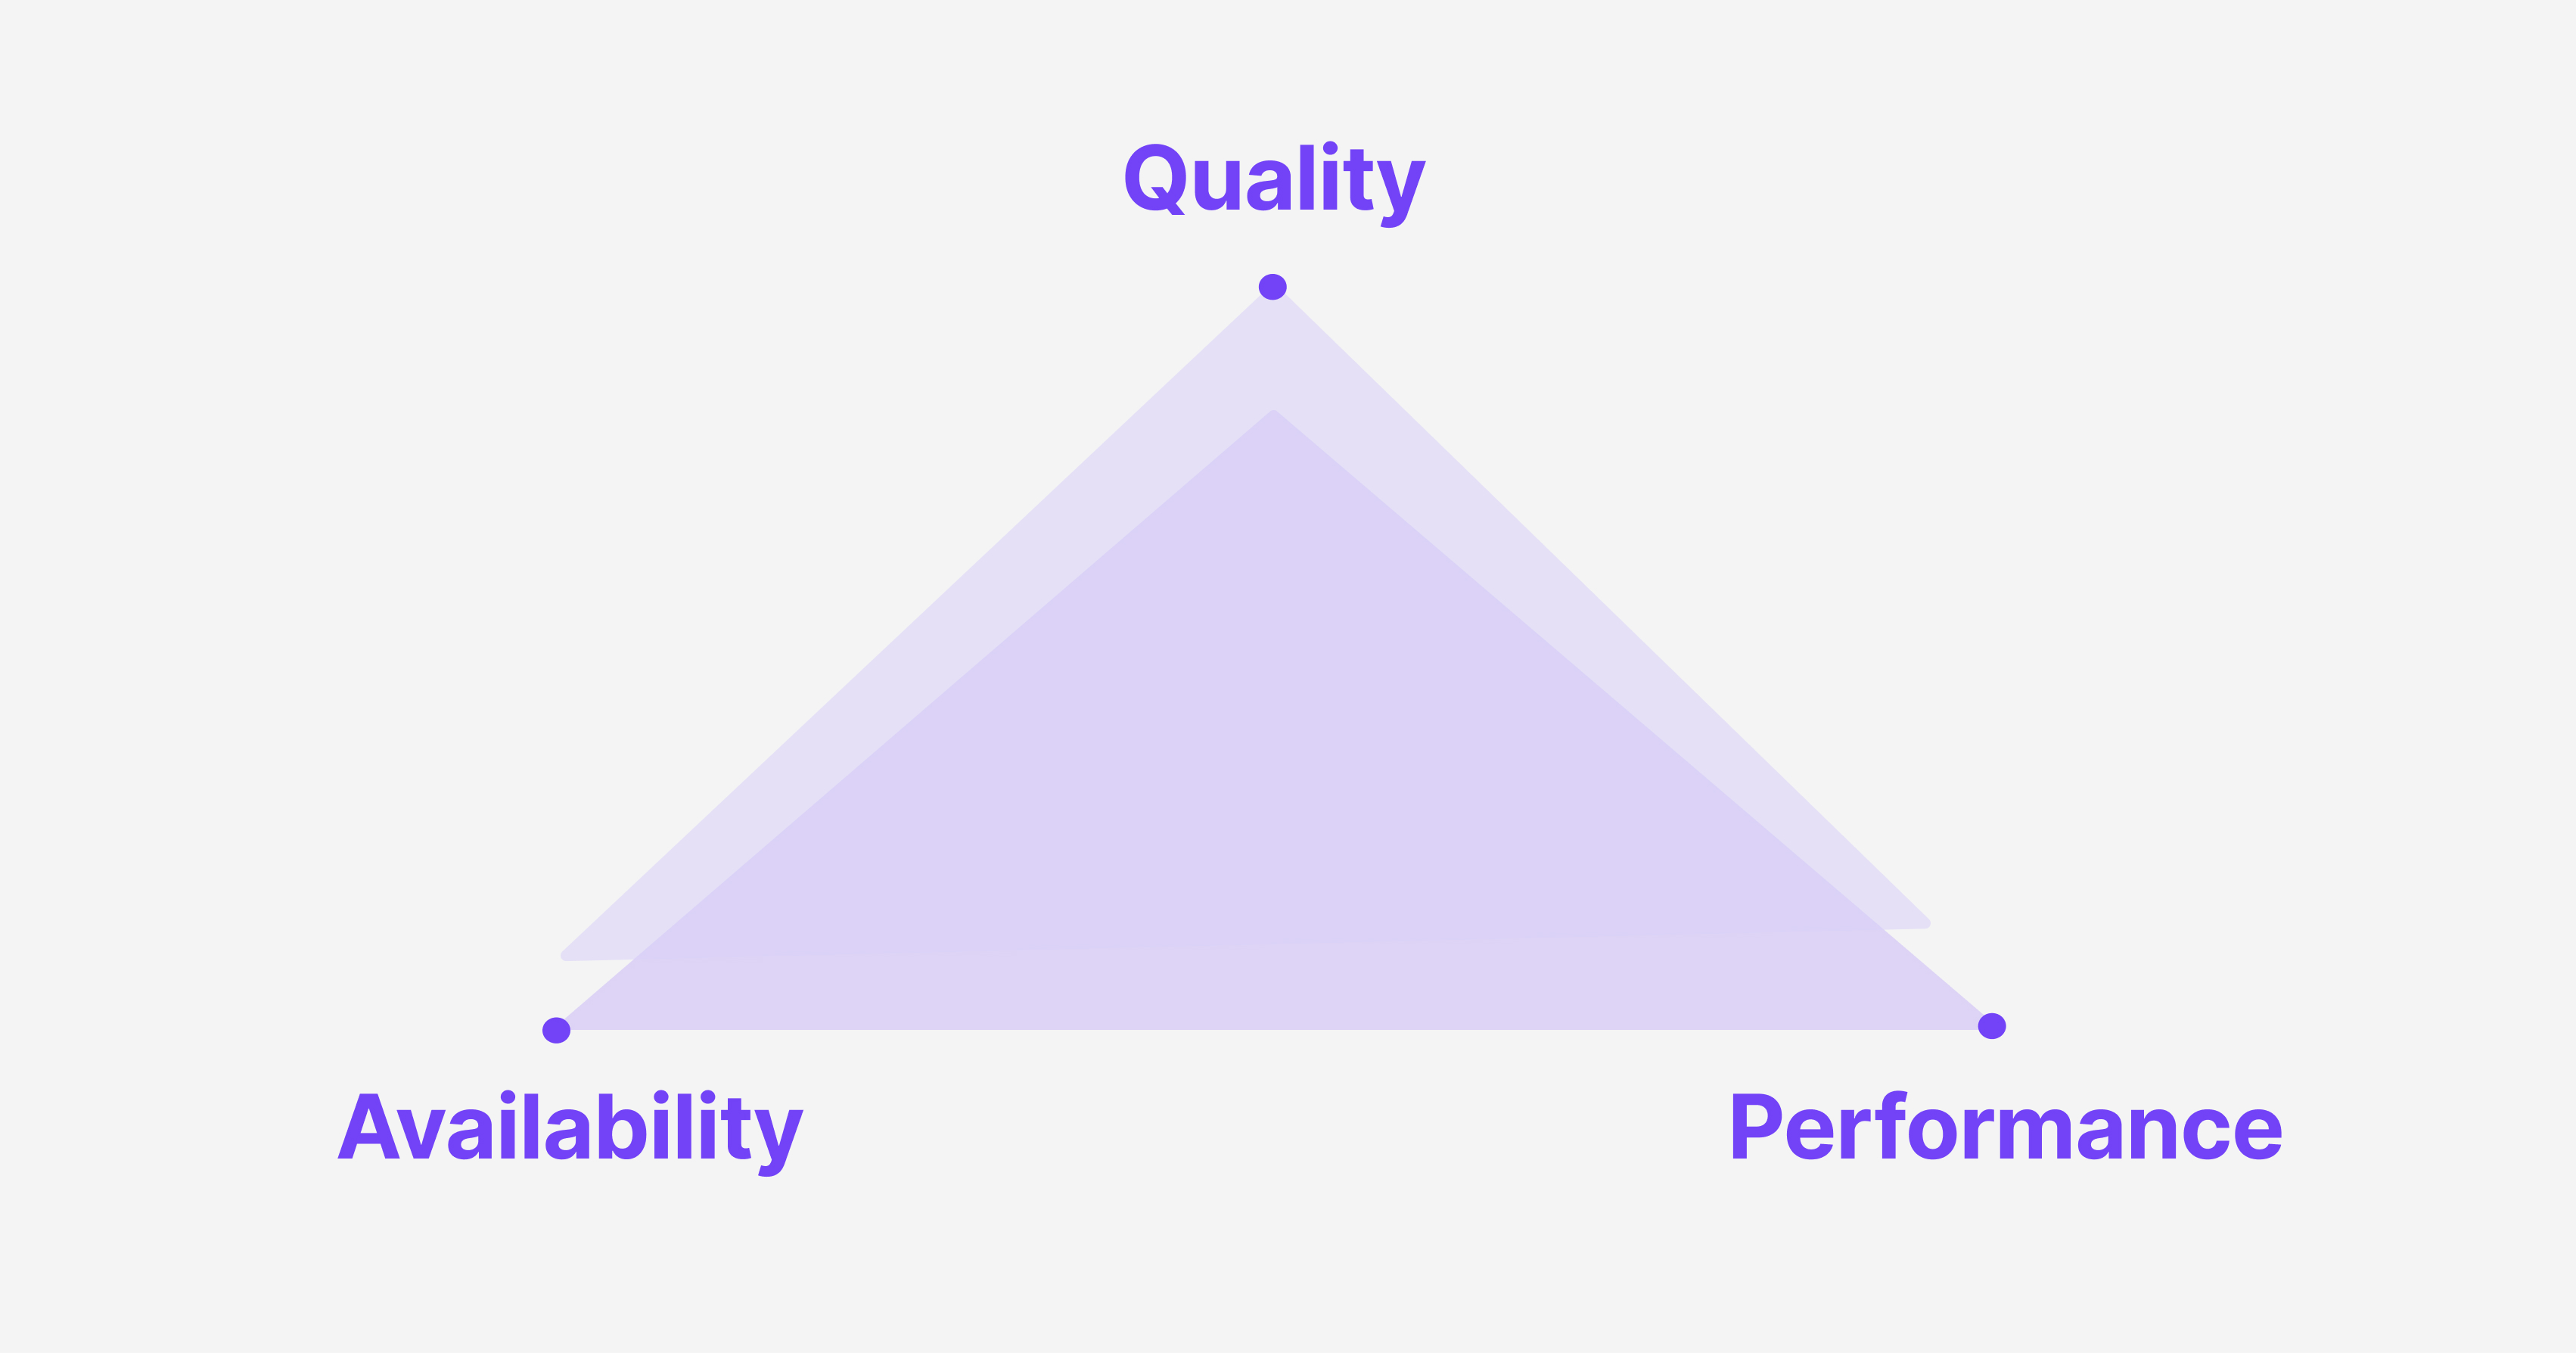
OEE is calculated by multiplying three factors:
- Availability (what share of planned time the equipment was actually running)
- Performance (how fast it ran versus its theoretical maximum while running)
- Quality (what share of output was good on the first pass).
A plant running at 72% overall could be failing on any one of those dimensions, or all three simultaneously. The number goes up, the number goes down, and without knowing exactly which component moved, you have no idea what you're actually dealing with. Or what it’s costing you.

The three components have very different financial profiles
Availability losses are visible. When a line goes down, people will notice it, and there is usually a record. This is why most sites have a reasonably accurate view of their downtime even without sophisticated monitoring tools.
Performance losses are different. It’s a category that covers everything that keeps equipment running slower than its rated speed while it is technically "running." This includes micro-stops that operators clear in under two minutes, gradual speed drifts as tooling wears, and variations in material that nobody logs. These losses are frequent, brief, and almost entirely invisible.
Research puts the effect of speed and minor stop losses on OEE between 9-15%, and the real figure is likely higher because it's very difficult to measure. A line can be losing the equivalent of a full shift per week to performance losses while every dashboard shows green.
Quality losses, like availability losses, tend to get tracked. Scrap is counted and reworks get logged. The numbers might be imprecise, but there is at least a process for capturing them.
The result of this is a predictable blind spot: reasonable visibility on Availability and Quality, and a significant gap around Performance. That gap has a dollar value, and most plants cannot calculate what it is.
Why your OEE can mask a growing problem
Because OEE is multiplicative of three factors, a gain in one place might mask a loss somewhere else. Availability improves because the maintenance team has been focused on preventing breakdowns, so the overall score ticks up. Meanwhile, speed losses in the Performance component accumulate slowly, and nobody flags them because the headline number is moving in the right direction.
This is also why cross-site comparisons based on the total OEE number can be actively misleading. Two plants that are both running at 65% OEE look identical from the outside. One has an availability score of 93% and a performance score of 71%. The other has an availability score of 70% and a performance score of 92%. These are completely different problems with completely different costs and completely different fixes. Treating them as equivalent because they share a headline number is how budgets get allocated to the wrong place.
What a finance officer should actually want to know
The right question is not "what is our OEE?" You should be asking "which component is dragging our OEE, and what is that costing us per shift?"
Once you separate out the three factors, losses become quantifiable in terms finance can work with. A 30-minute Availability loss has a cost: the number of units you would have produced in that window, at your current performance rate, multiplied by the margin per unit. A Performance loss that keeps a line running at 85% of rated speed for an entire shift has a different cost. And a Quality rate producing 2% scrap has a different cost again. Each one points to a different cause, a different fix, and a different payback period.
This is where OEE becomes a capital allocation tool rather than a production metric. If your performance losses are costing you the equivalent of one shift per week in output, and fixing them requires a software investment with a 4-month payback, that is a straightforward financial case. However, if your availability losses are costing you less but your maintenance team is already stretched, then the priority order looks different. The component breakdown is what makes that analysis possible.
Here’s a more concrete example: a factory producing 1,000 units per shift at 30% OEE. Improving to 45% means that same shift delivers 1,500 units, with no extra headcount and no new equipment. If the plant has been running a night shift to meet delivery targets, that shift may no longer be needed. The same improvement that lifts output also cuts labor cost, and that's the number that belongs in a business case.
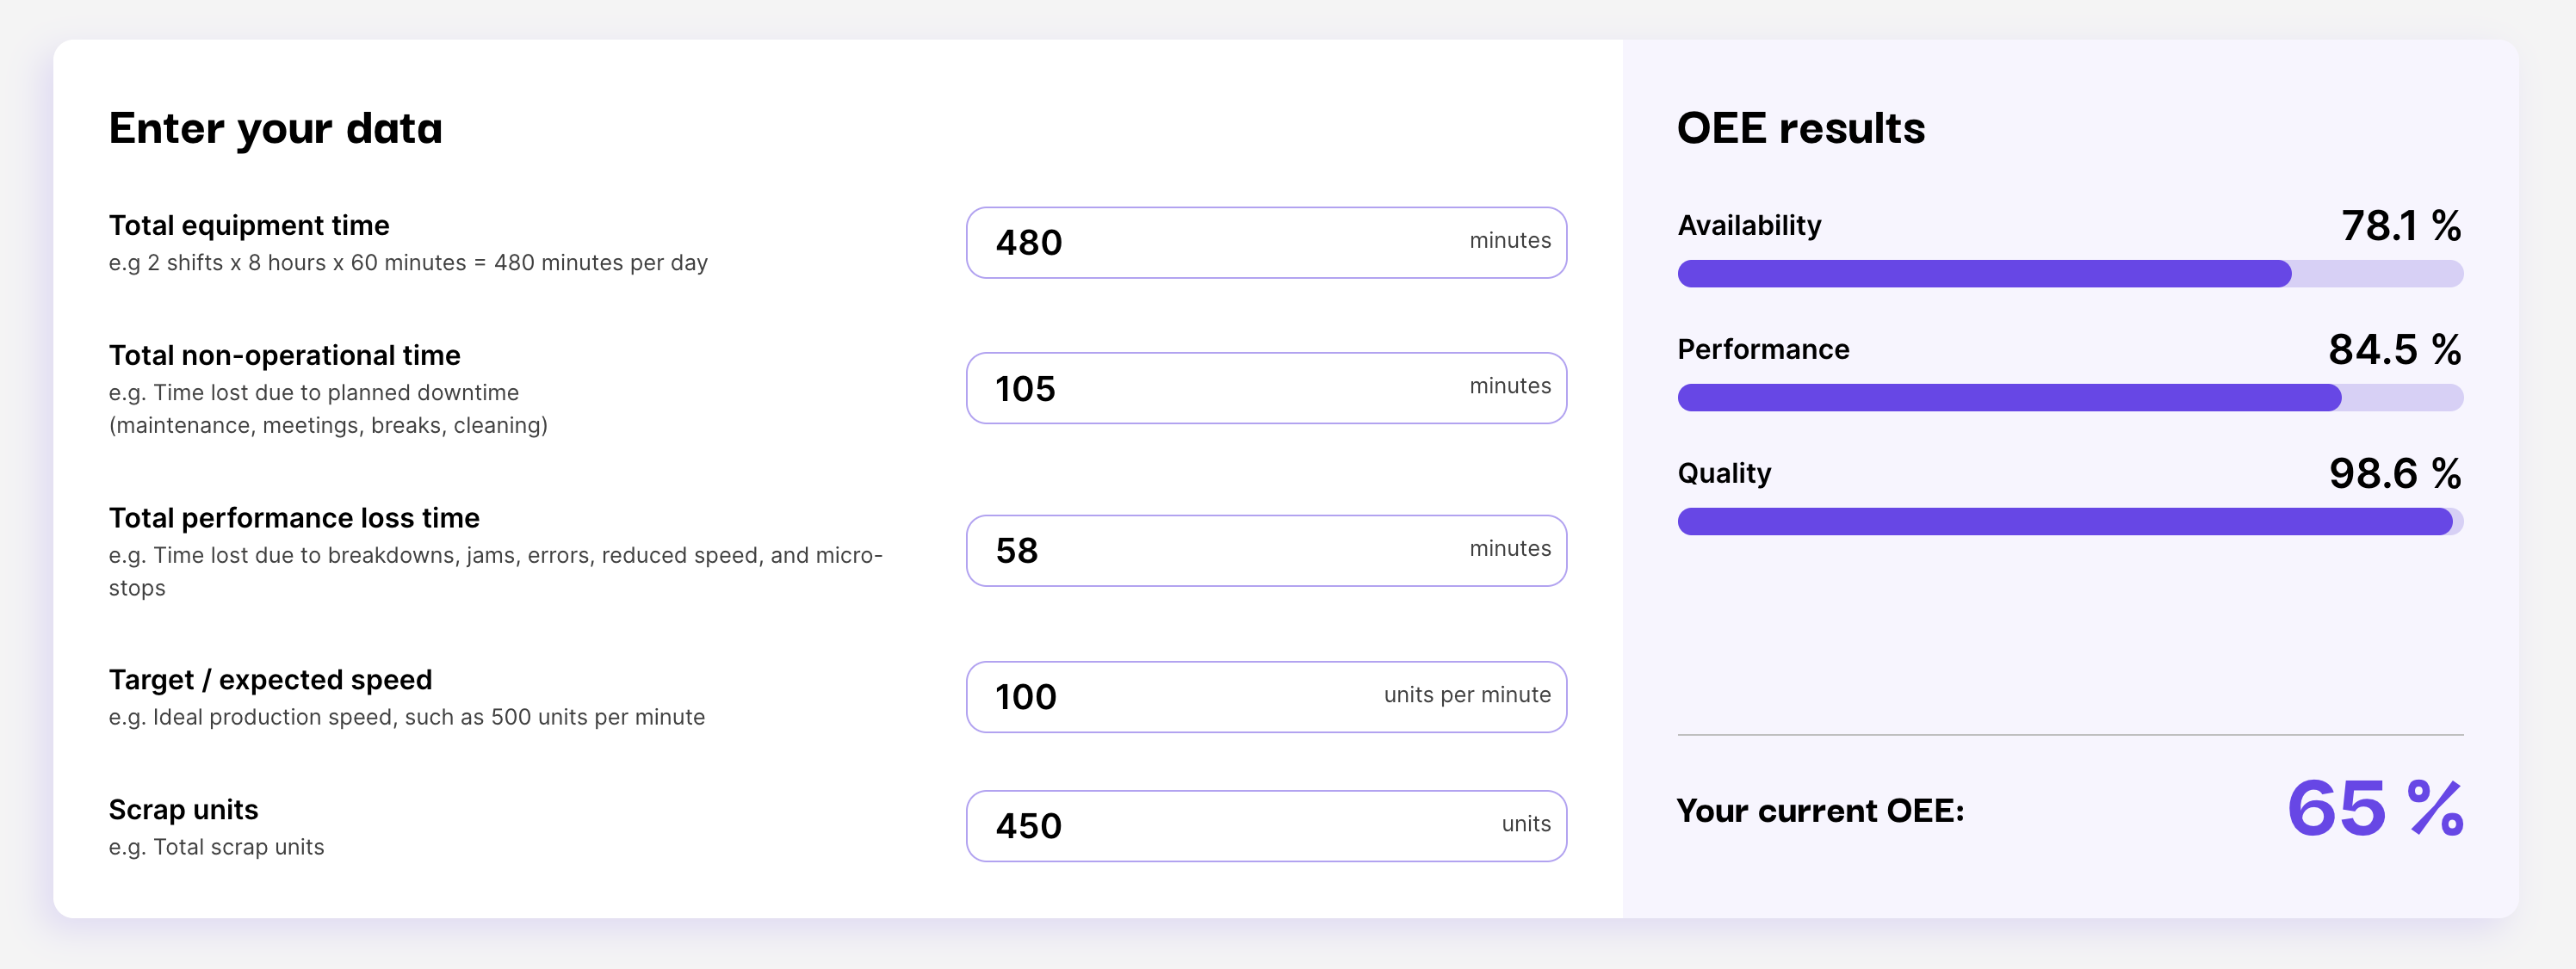
We built our OEE and ROI calculator around this logic. Plug in your production data, see your OEE broken down by component, check where you sit against your industry, and model what a specific improvement is actually worth in labor savings and additional output.
Your focus shouldn’t be on your OEE score. What you should dig into is the cost attached to each type of loss, and what you’ll save or gain from fixing it.

