Inconsistent shift performance is costing more than you think
Stop patterns and speed loss often hide in plain sight. This article breaks down where time disappears, and how real-time visibility helps teams respond faster.

Shift-to-shift inconsistency is one of those problems that feels normal until you do the math. The line runs. Product ships. Then you look up and realize you are still chasing the plan, even on “good” days.
Many plants are juggling more SKUs and more packaging formats than they were a few years ago. That often means shorter runs and more frequent changeovers, which makes stable throughput harder to hold.
Workforce pressure is real too. In PMMI research, 95% of surveyed consumer packaged goods companies reported struggling to hire skilled operators and technicians.
Add cost and supply uncertainty on top, and the margin for “small losses” gets thin. Deloitte flags how trade policy shifts and tariffs can push up raw material and component costs, with ripple effects through supply chains.
That’s why shift performance matters. It shows up in output, overtime, unit cost, and whether you can trust your capacity plan.
Leadership still wants more output, without the expensive version of output.
When people say “expand the footprint,” they usually mean adding capacity the hard way. Another line, more machines, more floor space, sometimes building work and utilities. It costs a lot, and it takes months to approve and install.
So most plants try to get more out of what they already have. The fastest place to start is the gap between shifts. Same line, same job, different results.
Same equipment. Different output.
Shift variation is everywhere in high-volume manufacturing. It rarely arrives as one dramatic breakdown. It’s usually a stack of small interruptions, small slowdowns, and small decisions made in good faith to keep product moving.
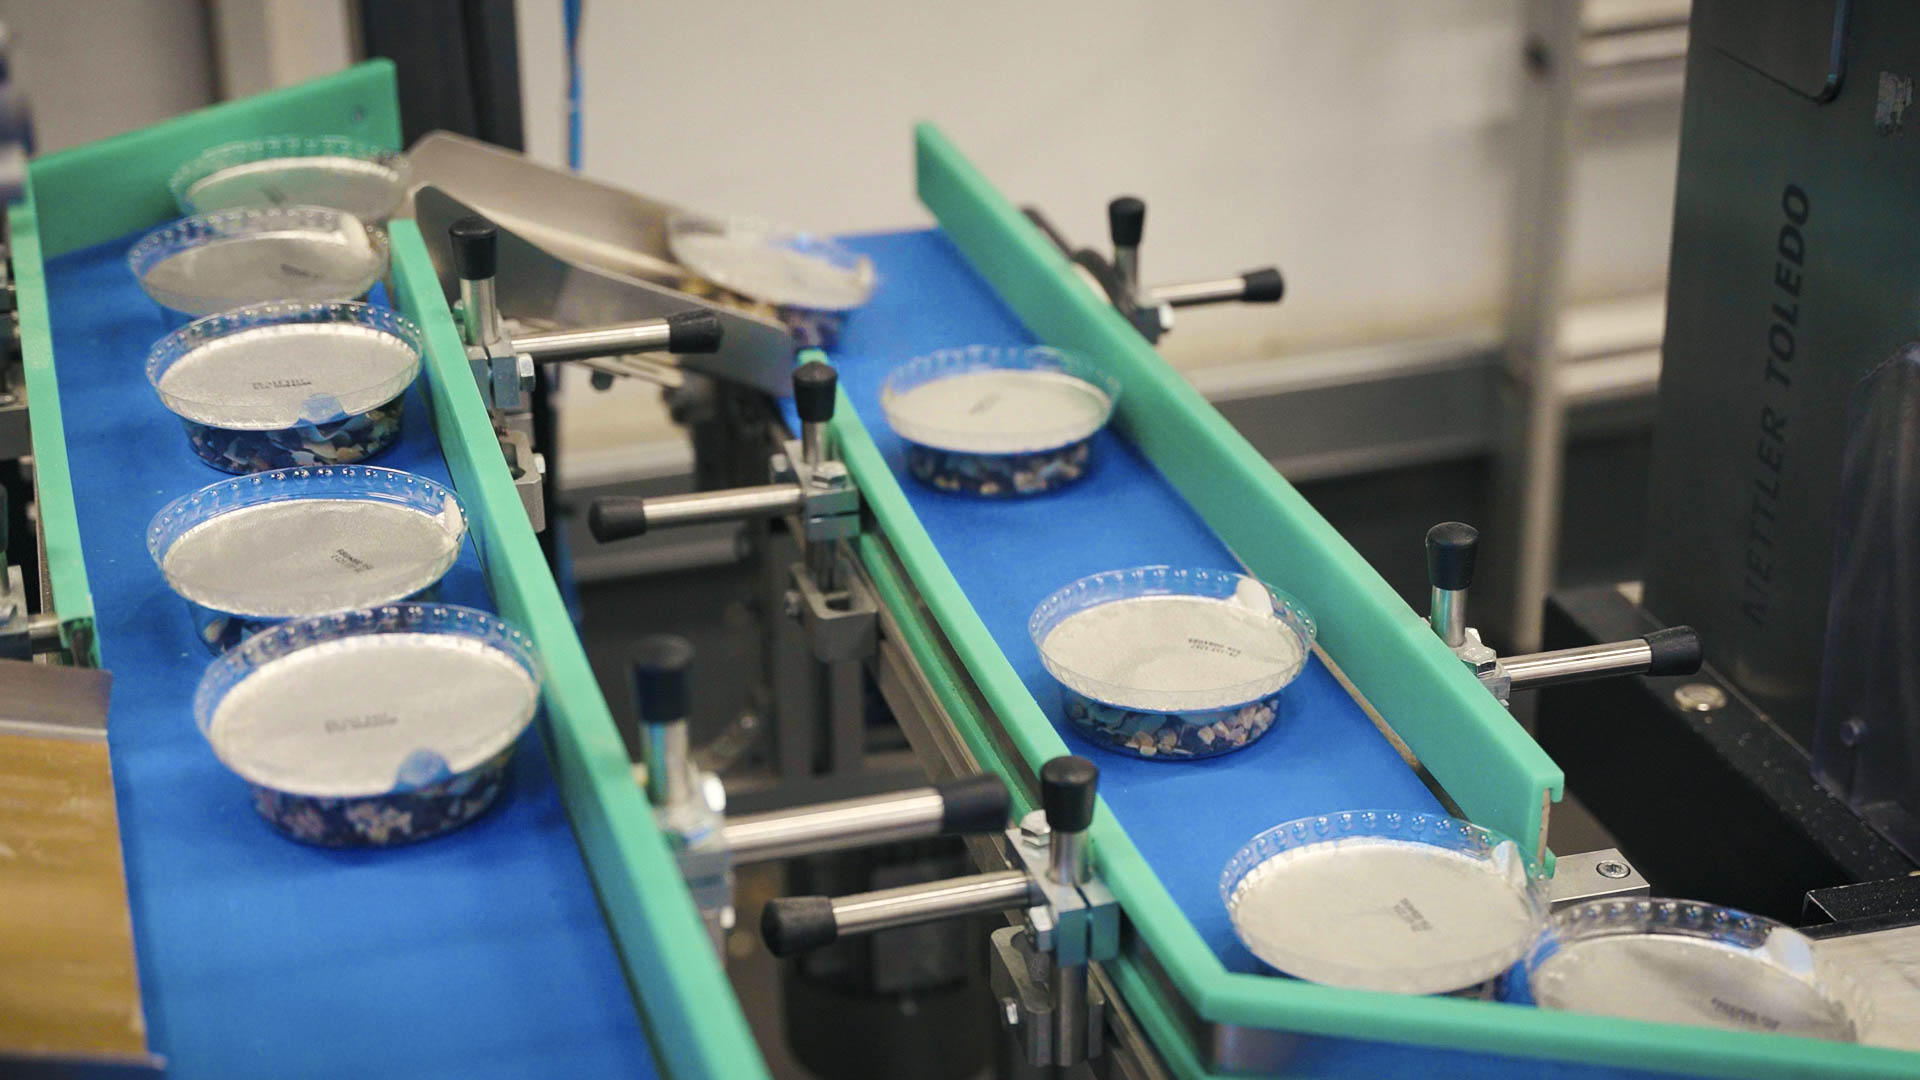
On a packaging line, it can look like a case packer that needs a nudge, a label roll that starts drifting, or film that tears, gets rethreaded, then tears again. A capper feels slightly off, so someone dials the speed back “just to be safe.”
In plastics, the pattern looks different but the effect is the same. Cycle time creeps up by a second, a process tweak protects quality but quietly pulls output down.
In blow molding and containers, you spend more time clearing small faults, or run below rated speed because conditions are not fully dialed in.
None of these issues are deal-breakers on their own. But the combined effect is a shift that never quite catches up.
A five to ten percent difference between shifts can seem small when you look at one day in isolation. Over a week, it turns into very real consequences:
- Missed throughput
- Overtime to recover lost volume
- Higher cost per unit
- Uncertainty about true capacity
High volume has a simple rule. Minutes turn into hours, and consistency becomes capacity.
Where the time actually disappears
Most lost time comes from two things. The line stops, or it runs slower than it should.
Researchers often group these losses the same way: availability loss from stops, and performance loss from running below standard. In plain terms, the line is either not running, or it’s running slower than planned.
Stops are easy to picture when something breaks down.What steals more time is everything that sits below “breakdown” on the pain scale. Short interruptions, small resets, tiny waits, and all the stop-start friction that adds up over the course of a shift. Speed loss is the other half of the story. The line is running, but it is not running at the standard pace it was planned for.
On packaging lines, that loss tends to hide in repetition. A small jam that clears in under a minute, then comes back. A changeover that stretches because a detail is slightly off, or because the first few minutes after startup need extra attention. A quality check that takes longer than expected because something looks inconsistent, which often leads to a cautious slowdown while the team keeps product safe.
Plastics shows the same pattern through cycle time and stability. You might see cycle time creep up by a second, then another. A parameter tweak that keeps quality stable but is costing you output. Waiting time can sneak in too, for material handling, drying, or tool readiness, especially when the schedule gets tight. Everything is running, but it is running “almost right,” and almost right is rarely enough at volume.
Container and blow molding environments add another layer. Rated speed might be achievable, but only when conditions are dialed in and small faults are cleared quickly. If faults start stacking, or quality starts slipping, the line will often keep moving while capacity quietly leaks away.
That’s why gaps between shifts are so common. Nothing here looks like a disaster when it happens. But by the end of the shift, the total is obvious, and the hardest part is you still can’t point to one clear reason why it happened.
The core issue is visibility during the shift
Many plants still rely on manual logs, operator notes, or end-of-shift summaries. Not because anyone is careless, but because the line does not pause for long enough for someone to update a spreadsheet.
By the time the numbers show up, the shift is already over. So is the chance to adjust and correct course.
The issue is timing.
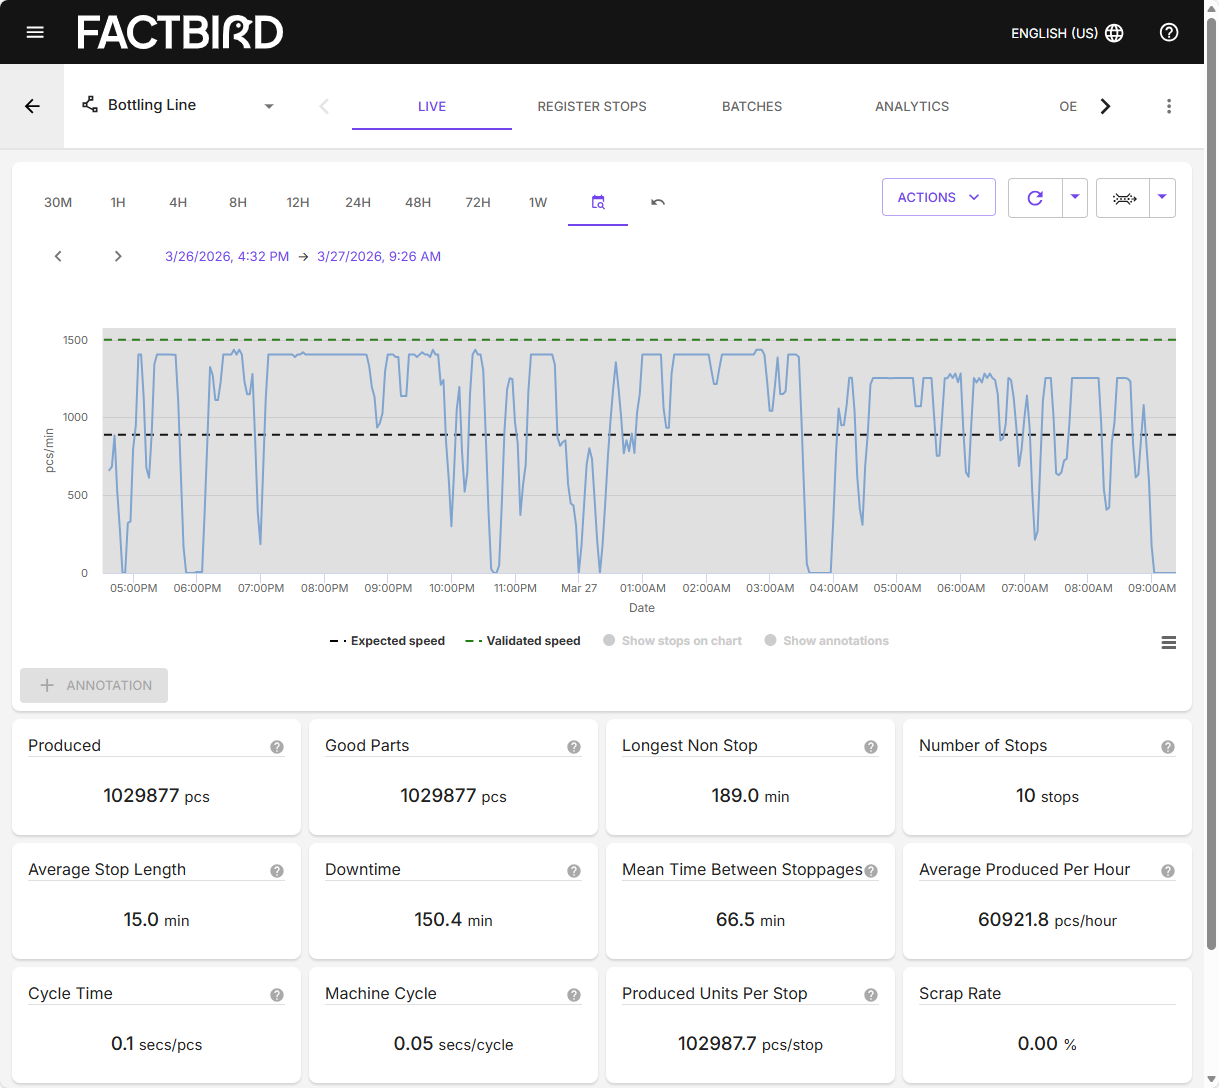
During production, teams often cannot see clearly, in one place, and in real time:
- Output versus target right now
- Actual run speed versus standard
- How many stops have happened so far, and where
- How much time those stops have cost
- How today’s shift compares to the last shift on the same job
Without that, the shift gets managed through memory and habit. The most experienced people often sense the drift early, but sensing is not the same as proving. And when you can’t prove it, it’s hard to fix it.
What real-time visibility changes
When performance is visible while production is still running, the shift gets easier to manage when you don't have to guess. Fewer “what happened?” debates after the fact. More chances to correct course while the line is still running.
Operators can spot drift early and react before it turns into a bad shift. Supervisors can support with facts, not competing memories. Maintenance can see repeat stop patterns and go after the few problems that keep coming back. And across shifts, you can finally compare apples to apples. Same job. Same line. Same standard.
It also makes improvement work easier to run.
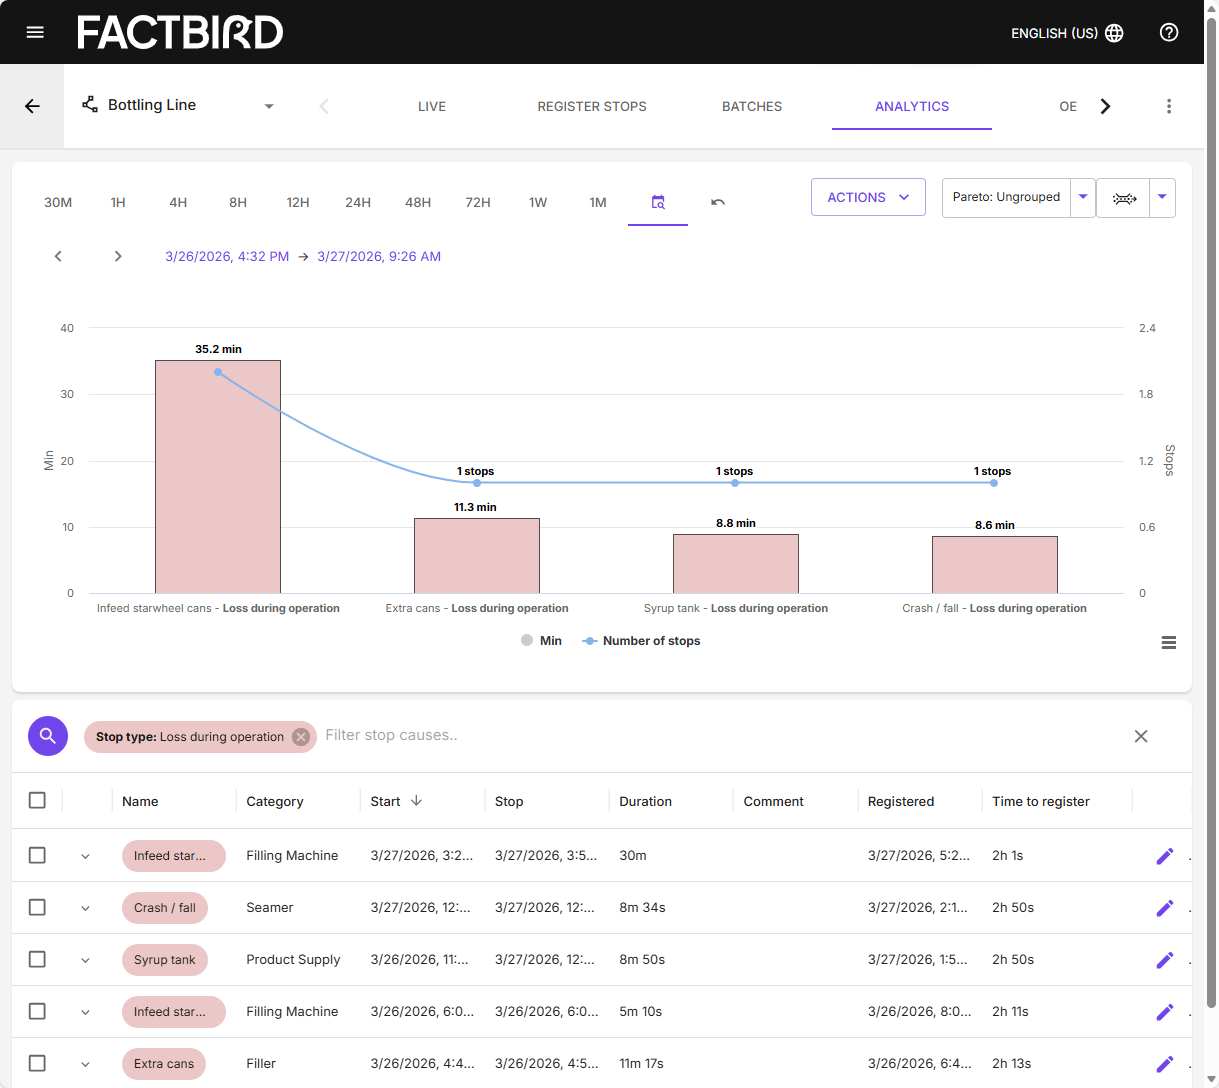
Instead of chasing every issue that shows up, you can focus on the few stop types or speed losses that account for most of the lost time. You try a change, see the impact quickly, and keep what works.
Even narrowing the shift gap by a few percentage points can give you hours back each week. No new building. No new line. Just fewer shifts spent catching up to a plan that should have been reachable.
What you can do about it, starting this week
You don’t need a big overhaul to make progress. You need clear signals during the shift, and a simple habit of acting on them.
Start with three moves:
1. Make stops and speed visible during the shift
Not after the report. Not next week. During production, so the team can react while the time can still be recovered.
2. Standardize how you describe loss
If one person calls it “jam” and another calls it “operator issue,” the pattern gets blurry fast. Agree on stop categories that match how your line actually behaves, then stick to them.
3. Turn repeat patterns into repeat actions
When the same stop shows up every day, it deserves a default response. A quick check. A small adjustment. A training note. A maintenance trigger. Something the team can do the same way, every time.
Do these three things well, and you’ll start to see the same few issues show up again and again. That’s good news. It means you can focus, fix, and hold the gains. The shift stops being a guessing game, and hitting your targets becomes repeatable.
Why Factbird fits packaging, plastics, and containers
In packaging, plastics, and containers, performance rarely disappears in one dramatic moment. It slips in small ways while the line is still running, which is exactly what makes it hard to manage without seeing it during the shift.
Real-time data helps because it turns small losses into something you can act on immediately.
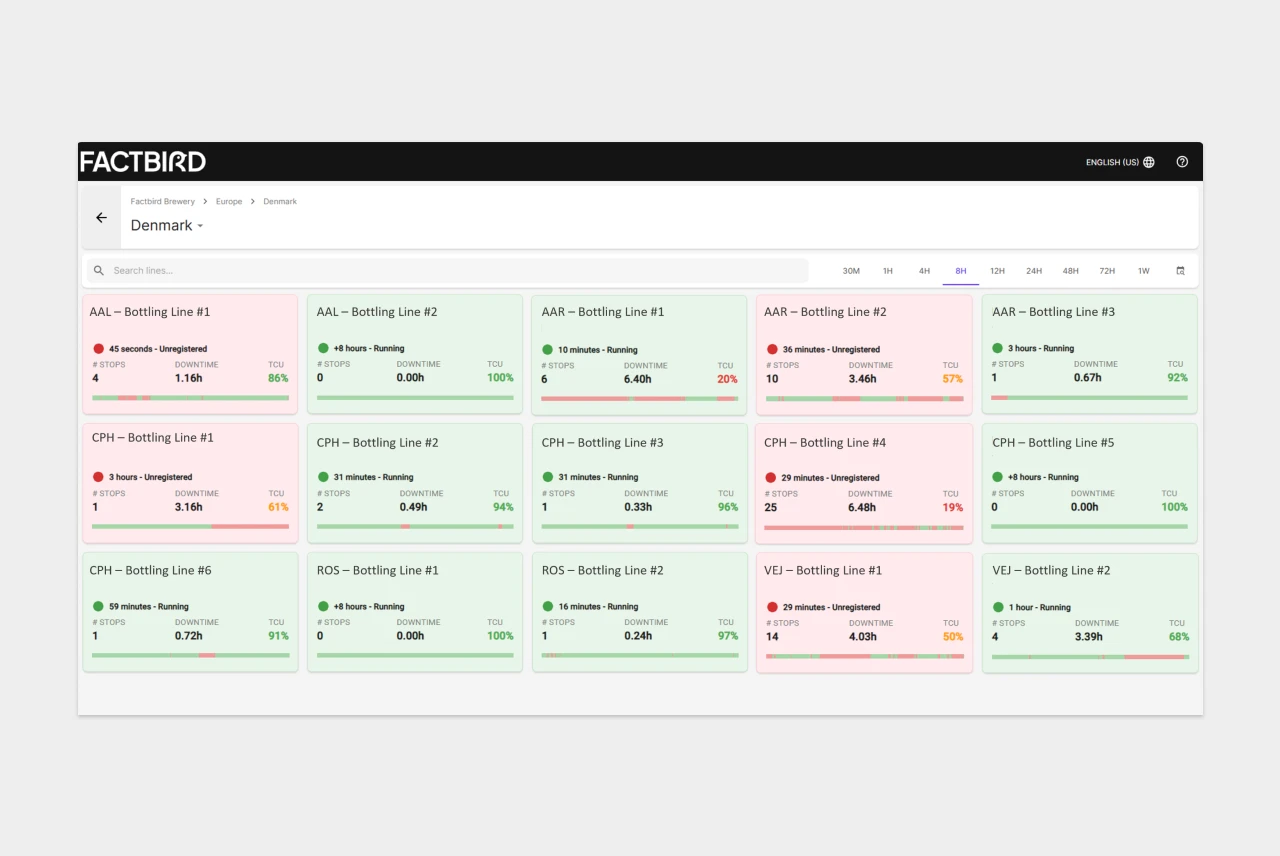
Factbird captures machine data and turns it into a live view that makes sense to the people running production. Operators, technicians, and leaders can see output, stops, and speed by shift, line, and machine as production happens. Instead of piecing together what happened yesterday, the team can respond during the shift, then carry the learning into the next one.
Factbird helps teams spend less time reconstructing yesterday, and more time stabilizing today. The result is a calmer shift. Fewer surprises, fewer debates, and more consistency on the line.
And that’s how you turn inconsistent performance into predictable output, without expanding the footprint. No new line, no new building project. Just more hours back from the plant you already have, with Factbird making it easier to see what’s actually stealing time, and where to start.