Die versteckten Energiekosten in Ihrer Stromrechnung
Die Rechnung steigt, und niemand kann sagen, warum. Hier sehen Sie, wo Energie wirklich verschwendet wird und wie ein Hersteller 33 Prozent einsparte.

Jeder Werksleiter kennt diesen Moment. Die Energierechnung kommt, und sie ist höher als im letzten Quartal, manchmal sogar deutlich. Die Finanzabteilung leitet sie mit der Frage nach dem Warum weiter. Der Werksleiter prüft zuerst das Offensichtliche: Ist die Ausbringung gestiegen? Nein. Ist eine neue Linie dazugekommen? Nein. Ist etwas kaputtgegangen? Zumindest hat niemand etwas protokolliert. Dann folgen die üblichen Erklärungen.
„Es war ein heißer Monat.“
„Die Tarife sind schon wieder gestiegen.“
„Das ist in dieser Jahreszeit eben so.“
Der Anstieg ist größer, als all diese Erklärungen hergeben, und alle im Meeting wissen das, auch wenn es niemand ausspricht.
Der eigentliche Grund ist einfach: Jede Linie, jede Schicht, der Kompressorraum und die Büros laufen alle über einen einzigen Zähler und eine einzige Zahl, die einmal im Monat aktualisiert wird. Diese Zahl zeigt Ihnen die Summe. Alles, was darunter liegt, bleibt ein Rätsel.

Die Kosten, die leicht übersehen werden
Die Energiekosten steigen aus strukturellen Gründen, und das in mehreren Regionen gleichzeitig. In den USA soll der Stromverbrauch 2026 und 2027 Rekordwerte erreichen, getrieben durch die Elektrifizierung der Industrie, das Wachstum von Rechenzentren und die allgemeine Wirtschaftsaktivität. In der EU lagen die Industriestrompreise für energieintensive Branchen 2025 im Schnitt bei mehr als dem Doppelten des US-Niveaus, und die durchschnittlichen Großhandelspreise stiegen um rund 10 Prozent gegenüber dem Vorjahr auf etwa 95 US-Dollar pro Megawattstunde. Ein beträchtlicher Teil dieses Stroms wird, egal wo das Werk steht, von Maschinen verbraucht, die gerade nichts produzieren. Und anders als beim Preis selbst ist das der Teil, den Sie beeinflussen können.
Diese Verschwendung versteckt sich meist an einer ganz bestimmten Stelle: im Standby-Modus. Danfoss, ein globaler Hersteller mit 95 Werken und mehr als 40.000 Beschäftigten, hat das herausgefunden, nachdem das Unternehmen begonnen hatte, den Energieverbrauch auf Maschinenebene zu überwachen. Der Standby-Verbrauch einer einzigen überwachten Maschine entsprach ungefähr dem durchschnittlichen Stromverbrauch von 9 Haushalten in Dänemark. Rechnet man das auf ein Werk mit Dutzenden Maschinen hoch, von denen viele über Nacht oder am Wochenende im Leerlauf laufen, ist das keine Kleinigkeit mehr.
„Energieverbrauch und Ausbringung direkt nebeneinander zu sehen, war für die Operations Manager ein echter Augenöffner“, so Martin Ole Madsen, Head of Manufacturing Systems and Services bei Danfoss
Die Daten zeigten, dass sich der Standby-Verbrauch der Pilotmaschinen durch kleine Änderungen beim Herunterfahren der Anlagen um bis zu 77 Prozent senken ließ. Im weiteren Verlauf reduzierte das Projekt den gesamten Energieverbrauch der Anlagen um 33 Prozent.
Warum Transparenz wichtiger ist als gute Vorsätze
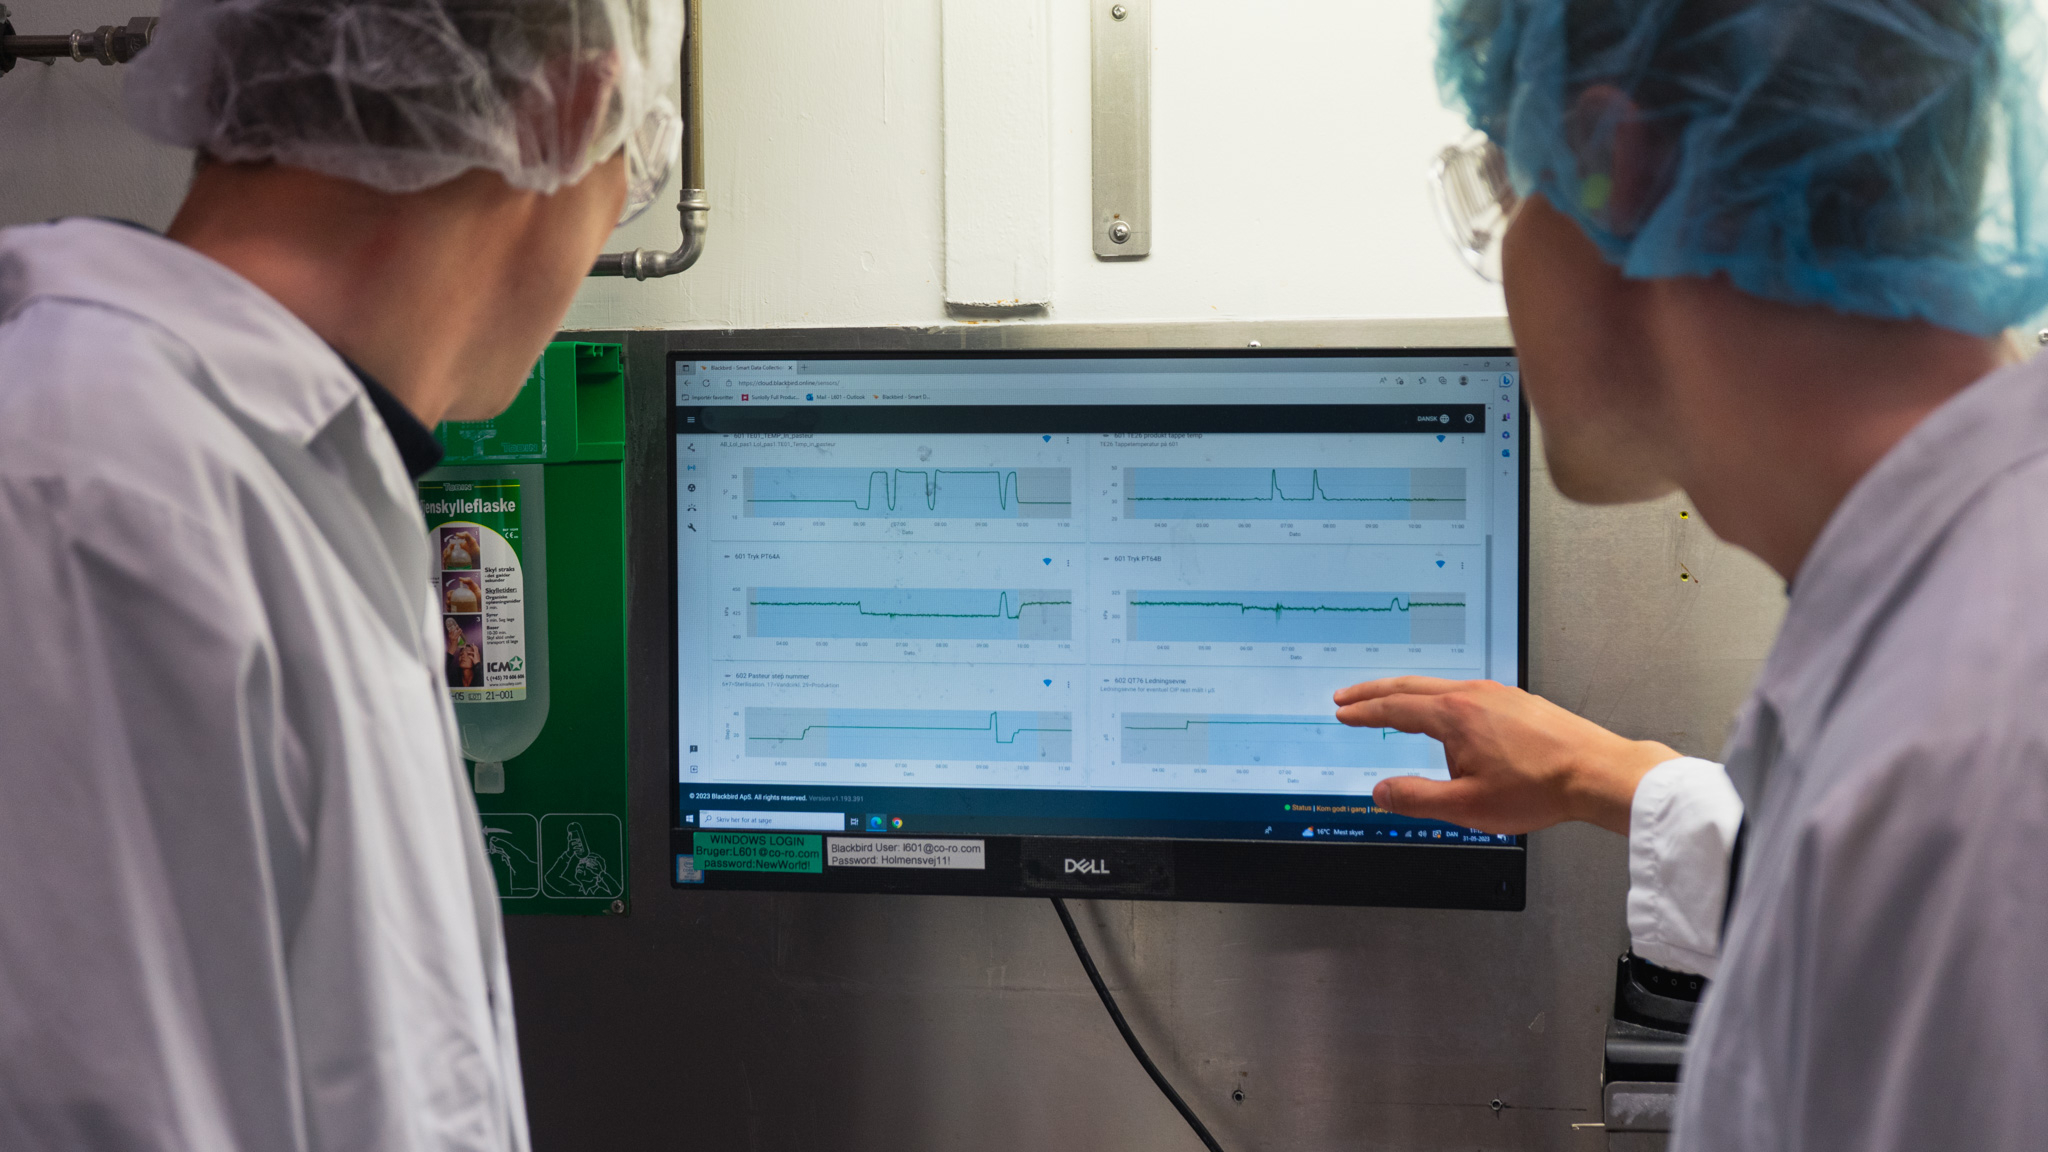
Energieverbrauch und Produktionsleistung liegen meist in zwei getrennten Systemen, sofern sie überhaupt detailliert erfasst werden. Eine monatliche Stromrechnung kann Ihnen nicht sagen, dass eine bestimmte Linie das ganze Wochenende über volle Leistung zieht, obwohl nichts darauf läuft. Daten auf Maschinenebene können das, weil sie direkt damit verknüpft sind, was die Linie in jedem Moment tatsächlich tut.
Nachhaltigkeitsberichterstattung und Kostenkontrolle greifen letztlich auf dieselben Daten zurück, auch wenn die meisten Unternehmen sie als zwei getrennte Themen behandeln, verantwortet von unterschiedlichen Teams mit eigenen Budgets und Fristen. Sobald der Energieverbrauch auf Maschinenebene sichtbar ist und den Produktionsdaten gegenübergestellt wird, beantwortet ein einziger Datensatz beide Fragen: die Zahl, nach der ein Kunde oder Auditor irgendwann fragen könnte, und die Zahl, die zeigt, wo Sie in diesem Quartal Kosten senken können.
Fangen Sie kleiner an, als Sie denken
Ein solches Projekt klingt vielleicht so, als bräuchte es einen eigenen Verantwortlichen, ein strenges, formales Reporting-Framework und monatelange Vorbereitung, bevor etwas Brauchbares dabei herauskommt. Danfoss hat jedoch einfach mit drei Maschinen in einem einzigen Pilotwerk begonnen. Die Erkenntnisse zum Standby-Verbrauch stammen aus diesem kleinen Anfang, und das innerhalb weniger Monate.
Ein ganz praktischer Grund, frühzeitig zu handeln
Es gibt auch einen regulatorischen Grund, sich damit zu befassen, und der betrifft mehr als eine Region. Die Corporate Sustainability Reporting Directive (CSRD) der EU wurde Ende 2025 deutlich eingeschränkt und gilt nun direkt nur noch für Unternehmen mit mehr als 1.000 Beschäftigten und über 450 Mio. € Jahresumsatz. Kaliforniens SB 253 folgt einem ähnlichen Muster: Unternehmen mit mehr als 1 Mrd. US-Dollar Jahresumsatz, die in dem Bundesstaat tätig sind, müssen ab 2026 ihre Scope-1- und Scope-2-Emissionen offenlegen. In beiden Fällen trifft die direkte rechtliche Pflicht große Unternehmen, und die meisten mittelständischen Hersteller fallen nicht darunter.
Warum die Anfragen von Kunden trotzdem immer wieder kommen: Unternehmen, die weiterhin berichtspflichtig sind, müssen neben ihren eigenen Emissionen auch Scope 3 ausweisen, also die Emissionen entlang ihrer Lieferkette. Eine Studie der MIT Sloan nennt fehlende Lieferantendaten als größtes Hindernis dafür, angegeben von rund 70 Prozent der befragten Unternehmen. Ein Hersteller, der eines dieser Unternehmen beliefert, ist das fehlende Puzzleteil im Bericht eines anderen, und die meisten Zulieferer können diese Daten nicht liefern. Damit wird eine Datenanfrage zu einer echten Chance und nicht nur zu einem weiteren Compliance-Häkchen.
Eine solche Anfrage trifft Sie hart, wenn noch keine Datenerfassung vorhanden ist. Sind Energiedaten auf Maschinenebene dagegen bereits fester Bestandteil des Werksbetriebs, ist sie ein schneller Export. Manche Hersteller streben aus einem ähnlichen Grund eine Zertifizierung nach ISO 50001 an. Dieser freiwillige Standard für Energiemanagement gilt unabhängig von Unternehmensgröße und Region und unabhängig davon, wie die Berichtspflichten in einzelnen Ländern gerade aussehen.
Was es dafür tatsächlich braucht
Drei Dinge sind hier wichtiger als alles andere:
- Beginnen Sie auf Maschinenebene, nicht am Hauptzähler. Dieser Artikel begann mit einem Werksleiter, der auf eine höhere Rechnung starrt und sie nicht erklären kann, weil eine einzige Monatszahl nur die Summe zeigt. Erst Daten auf Maschinenebene zeigen, wohin die Energie tatsächlich fließt, Linie für Linie und Schicht für Schicht.
- Schauen Sie sich zuerst den Standby- und Leerlaufverbrauch an. Das ist die Art von Verschwendung, die am leichtesten übersehen wird, weil nichts kaputt aussieht und niemand gezielt darauf achtet. Meist ist es auch der größte Gewinn für den geringsten Aufwand: Danfoss fand allein beim Standby-Verbrauch ein Einsparpotenzial von 77 Prozent, ohne in den eigentlichen Betrieb der Linien einzugreifen.
- Nutzen Sie die gewonnenen Daten für zwei Aufgaben zugleich. Es sind dieselben Informationen, ob Sie in diesem Quartal Ihre Kosten prüfen oder im nächsten Jahr die Anfrage eines Kunden nach Emissionsdaten beantworten. Einmal erfasst, stehen sie für beides bereit.
Das Energiemonitoring von Factbird erfasst Strom, Wasser, Gas und Druckluft genau auf dieser Ebene und setzt die Werte in Bezug zur Produktionsleistung. So stehen dieselben Daten für beide Aufgaben bereit, sobald Sie sie brauchen.
Wenn Sie sehen möchten, wie das bei einem Hersteller aussah, lesen Sie die vollständige Danfoss Story.